
Dependency Map for Jira Cloud
Dependency mapping is a critical success factor for agile teams to be able to work efficiently with development. It will make you more efficient, lower your risk of delays and give teams a better possibility to act proactive as they see how systems and teams depend upon each other. The Jira plugin Dependency Map has been available for some time, and now we are happy to announce the launch of Dependency Map for Jira Cloud.
If you are working with agile projects in Jira, but you haven’t tried Dependency Map before, this blog will present six different scenarios to illustrate how this tool might be useful for you. You will learn how visualization can help developers with planning, follow up and risk mitigation, how to analyze and resolve common dependency related problems in Jira, how to explore your Jira projects from different perspectives and how to set up scenario specific visualizations for different roles.
Should you want to learn more, we welcome you to the start page of this website where you have several different options to engage. You can for example book a demo, do a free trial or contact us in any other matter.
Milestone planning
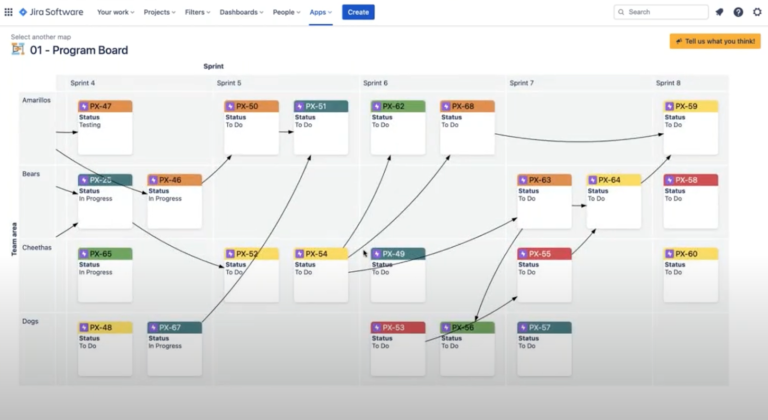
One important map in the Dependency Map for Jira is the Program Board. You can have all of your Jira issues pulled in via a filter of your choice. If you look at the image below you can see an example with Epics from a project in Jira. We have the different sprints in columns and the teams in rows.
As you’ll learn, Dependency Map allows you to set rows, columns, colors and arrows to visualize almost any Jira field you have. In this map, the arrows show dependencies between different Epics, both within a team and across teams. The colors show the degree of importance of the Epic, in order to help the teams to prioritize.
Here you want to make sure the arrows go from left to right. One common problem is to have something be dependent on something planned to be executed later on (see Epic PX-56 in sprint 6 in image below). Other dependencies make it complicated to move to another team or sprint, but with visualization of dependencies and prioritization, you will be able to see what you can move to solve the puzzle.
The solution here is to replan and place the Epic PX-56 in a later sprint.
Hidden dependencies
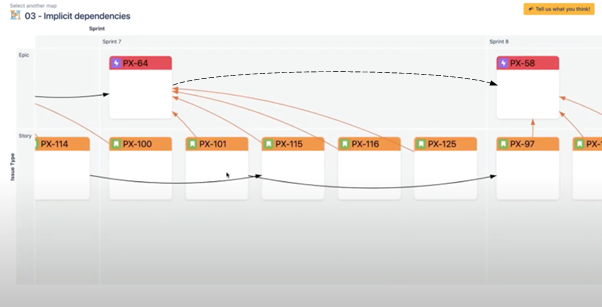
This scenario can also occur during the Milestone planning phase. Here we have pulled in Stories as well, using another Jira filter. The same can be done with Tasks, but we have Stories in this example. If you look at the image below you can see an example of the map Implicit dependencies with sprints as columns and issue types (Epics and Stories) as rows.
We want to make sure that dependencies between Stories are also reflected on the Epic level, to make sure the Program Board view (see previous section) is correct.
Looking at this map you will see that the Story PX-97 in sprint 8 is blocked by the Story PX-101 in sprint 7. Since the two Stories belong to different sprints, there should also be a dependency marked between the Epics in sprint 7 and sprint 8. Otherwise the Program Board (in the previous section) will not be showing all dependencies correctly.
The solution is to visualize this hidden dependency by blocking the Epic PX-58 by the Epic PX-64 (see the added dotted arrow). Now the Program Board will display a more accurate picture of all dependencies.
External dependencies
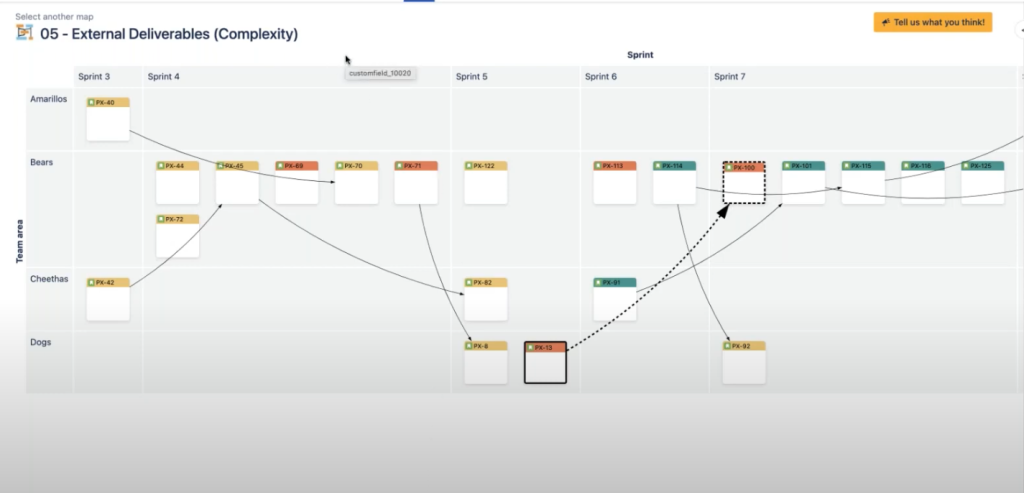
We remain in the Milestone planning phase. The scrum master might want to see what deliveries to and from other teams look like. In this scenario (see image below) you are the scrum master of team Bears and you have pulled in the Stories for your team. All the arrows point in the right direction, so no worries there. But if you add Technical complexity to this view, you will be able to identify high risk items.
The example below shows high-complexity in red, mid-complexity in yellow and low-complexity in green. You can see that team Bears have an item of high complexity in sprint 4 delivering out to team Dogs in sprint 5. That is something to look out for, and make sure it is not delayed.
You can also see that team Dogs have an item of high complexity in sprint 5 delivering to another high complexity item in your team (team Bears) in sprint 7 and on top of that the two items are also dependent on each other, visualized by the dotted arrow. This is definitely something the scrum master should pay extra attention to.
Team monitoring
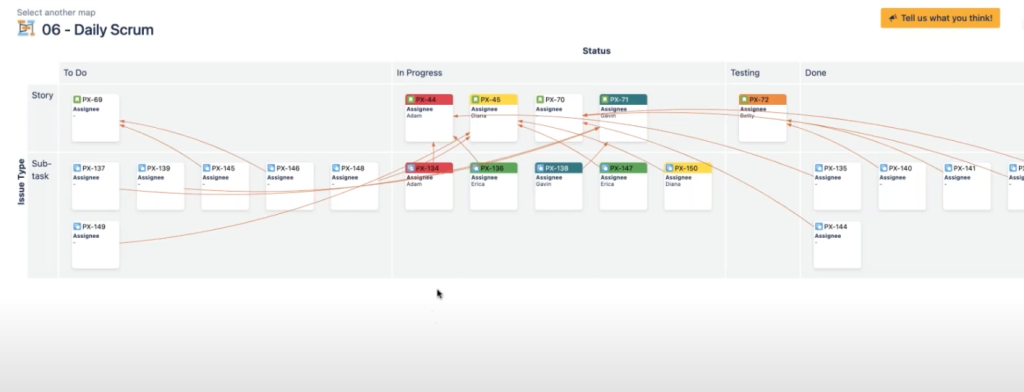
Here we shift focus to a day-to-day follow up of progress. The map Daily scrum (see image below) shows team Bears statuses as columns and issue types as rows. Here we have pulled in Stories and Sub-tasks using a Jira filter and the different colors represent different team members.
Both Gavin and Diana currently have Stories in the status In Progress, that are dependent on sub tasks that are still in the status To Do. Unless those tasks are assigned and tended to as soon as possible, they might not be able to finish on time.
The scrum master for team Bears can flag this and make it visual as “At risk”. If it affects an Epic, the Epic needs to be flagged as well to reflect this in the Program Board. The scrum master should also check the map External deliveries (previous section) to see if it is necessary to inform a scrum master for another team, of delays in deliveries they depend on.
Risk mitigation
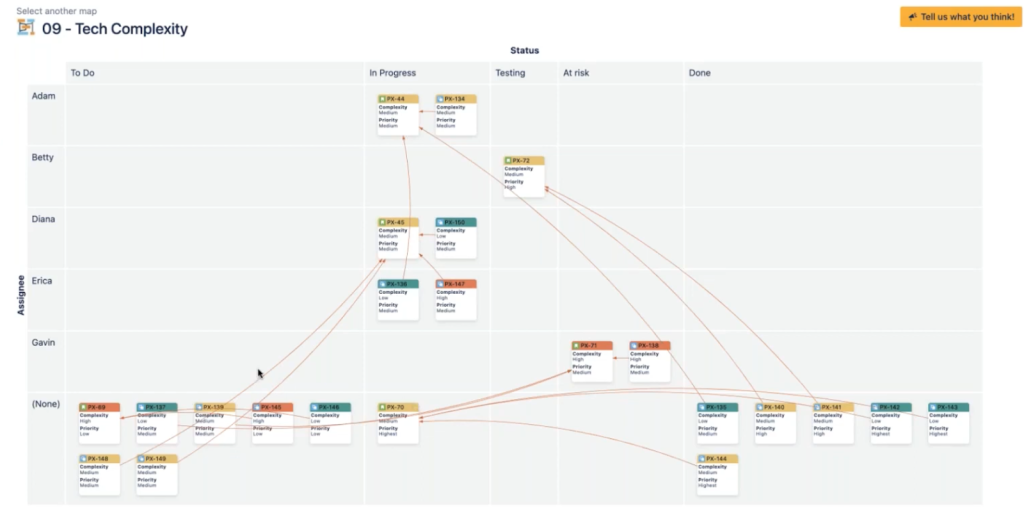
Another important part for the scrum master to keep track of, is opportunities of risk mitigation. Using the map Team workload with Technical complexity added on to it, will help the scrum master to plan for this.
Below you will see an example of a map like that, where we have the statuses as columns and assignees as rows. The technical complexities are color coded where red is high-complexity, yellow is mid-complexity and green is low-complexity.
Erica has a lot on her plate right now. She is delivering to other team members and one of her deliveries has a high technical complexity. Gavin also has a problem, waiting for issues to be solved that are still in To Do. Betty is testing something of a lower complexity, so maybe she can step in and support Erica or Gavin?
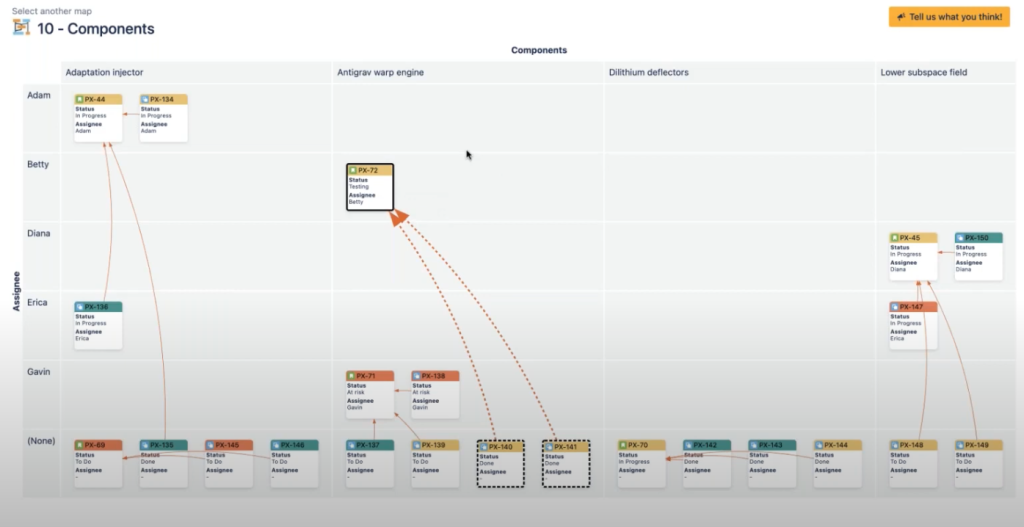
Before the scrum master decides who Betty should support, it is a good idea to take a look at a map of the Components, which will give indication on deliveries Betty already has insights on.
The Component map below shows that the deliveries at risk, which Gavin has, are within the same Component (Antigrav warp engine) as the task Betty is already working on. So instead of asking Betty to support Erica, it is a better idea to ask Betty to support Gavin, to mitigate the risk of the sprint to be delayed.
Release status
In this last scenario, we want to show you how a Business owner might want to use Dependency mapping for Jira or Jira cloud. The Business owner could be interested in seeing a Project Dashboard where all the sprints, dependencies and statuses of deliveries are visualized.
In the example below we show a map of a so called Project Anatomy. The Business owner will not be happy to see that the Epic PX-46 is at risk. Other items are depending on this delivery, so this could risk the deadline of the entire project.
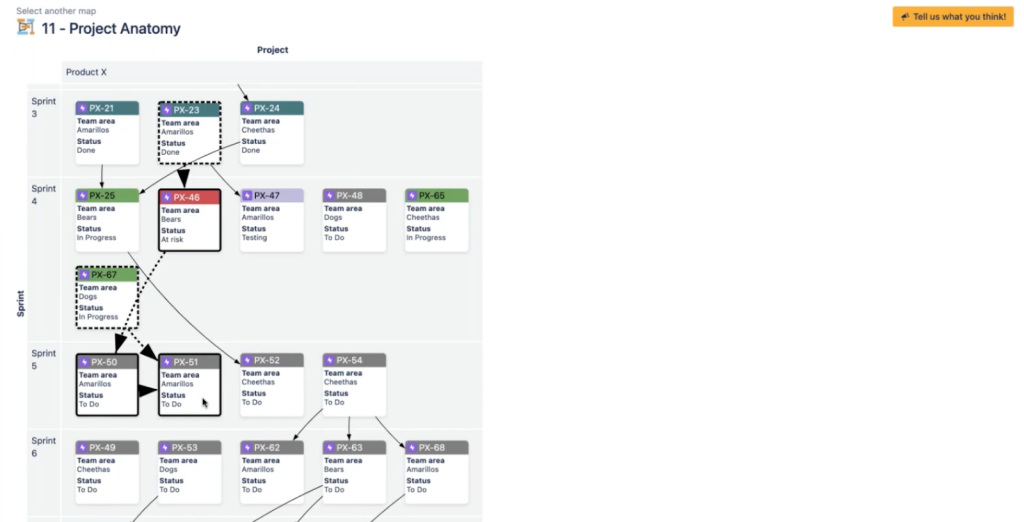
Here, the Business owner can switch to the map of the Program Board, and see what teams are involved and talk to the team leaders or scrum masters about risk mitigation.
Why visualizing dependencies?
By now you probably already understand the importance of visualizing dependencies. But to make it even easier to grasp, we summarize below. Visualizing dependencies promotes:
- Efficiency
- Higher quality in decision making
- People sharing the same view of the situation
- Reduction of risk for delays or change of scope
- Proactive communication
As we said in the beginning of this blog post, our tool Dependency Map for Jira has been available for some time, but we have just made it available for Jira cloud as well.
Read more about Dependency Map for Jira cloud here
Should you want to learn more, we welcome you to our website to book a demo, do a free trial or contact us in any other matter.