Use cases
Discover how Dependency Map makes your job easier
We have gathered use cases for Product owners, Scrum masters and Release train engineers. Choose the role that suits you best and get relevant use cases for your needs.
Join 100+ companies improving their agile workflow


Product owner
Maximise customer impact and keep track of technical dependencies at the same time
As an agile product owner, you want to deliver the most important features first. The most common way to prioritise features is through a backlog, where stories are listed by priority.
A backlog is great for keeping track of the implementation order of your stories, but it does not show technical constraints. Sometimes, it is just impossible to finish stories in the preferred priority order. With Dependency Map, you can see both priorities and technical constraints in the same visualisation!
In this Map, stories are grouped by Priority. The arrows are Blocks links – technical dependencies.
A visualisation like this makes it easy to spot potential planning problems.
The highlighted “Integrated cockpit systems” Story has a lower Priority than the “Passive safety” Story. But the dependency states that “Integrated cockpit systems” has to be completed first!


Adding the Sprint field to the Map provides a great overview of how stories are prioritised in each sprint.
You can move issues directly in the map with a few mouse clicks, so exploring different “what-if” scenarios becomes a breeze!
And because you are modifying the actual Jira issues, your database is kept up to date while you work.
Epic-to-Story and Story-to-Subtask relations makes it easy to see the breakdown of the project.
In this example, color has been mapped to Status, which makes it easy to spot Epics and stories that are at risk! (If you don’t like the default colors it is easy to change them.)


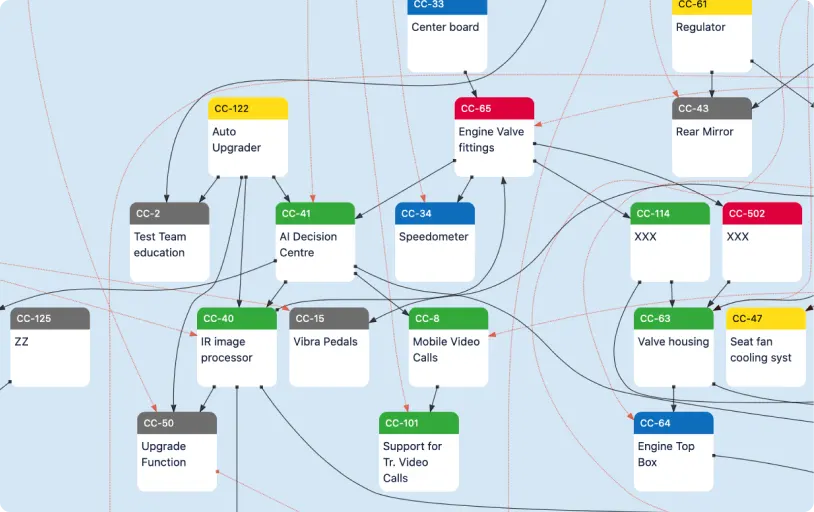
You can include different link types in the same Map.
This example, which uses an ungrouped layout, has both Epic-to-Story relations (black dashed arrows) and dependencies (thick red arrows).
The colors have been selected to represent Issue Type.
Once a sprint is underway, you want to keep track of progress.
In this example, the top row represent what’s being done in the current sprint (Chassis Sprint 4). As the team finishes tasks, the issues will progress from left to to the right.
Issues at risk are colored red. By selecting them in the map, you can immediately see if any other issues could be affected.
