Version history
Content
- Introduction
- Getting started
- Searching for maps
- Favourites
- Configuring maps
- Selecting issue colors
- Configuring link types
- Configuring issue content
- Ungrouped layout
- Sections layout
- Matrix layout
- Simplifying and changing group names using regular expressions
- Merging groups
- Advanced options
- How to work with a dependency map
- Sorting rows/columns
- Filtering rows/columns
- Exporting maps
Introduction
Dependency Map is a tool for analyzing dependencies and other relationships between issues in your Jira projects. You can highlight different aspects of your project by configuring Dependency Map to use different link types, Jira fields, and diagram layouts.
Since the issues that are shown in your maps are fetched using standard Jira filters, you can choose precisely what to include and what to leave out.
You can also edit issues and links directly in your maps.
Getting started
After Dependency Map has been installed, a new menu (“Dependency Map”) will become visible in Jira’s navigation bar.
The menu contains the following items:
- My favourite maps: Navigate to a page where you can view and configure your favourite maps.
- Search for maps: Navigate to a page where you can search for maps on your Jira server, so you can view/edit them or add them to your favourite maps.
- Create new map: Navigate to a page where you can add a new map to your Jira server.
- Preferences: Change settings for Dependency Map for your user account.
Searching for maps
The Search for Maps page looks like this:
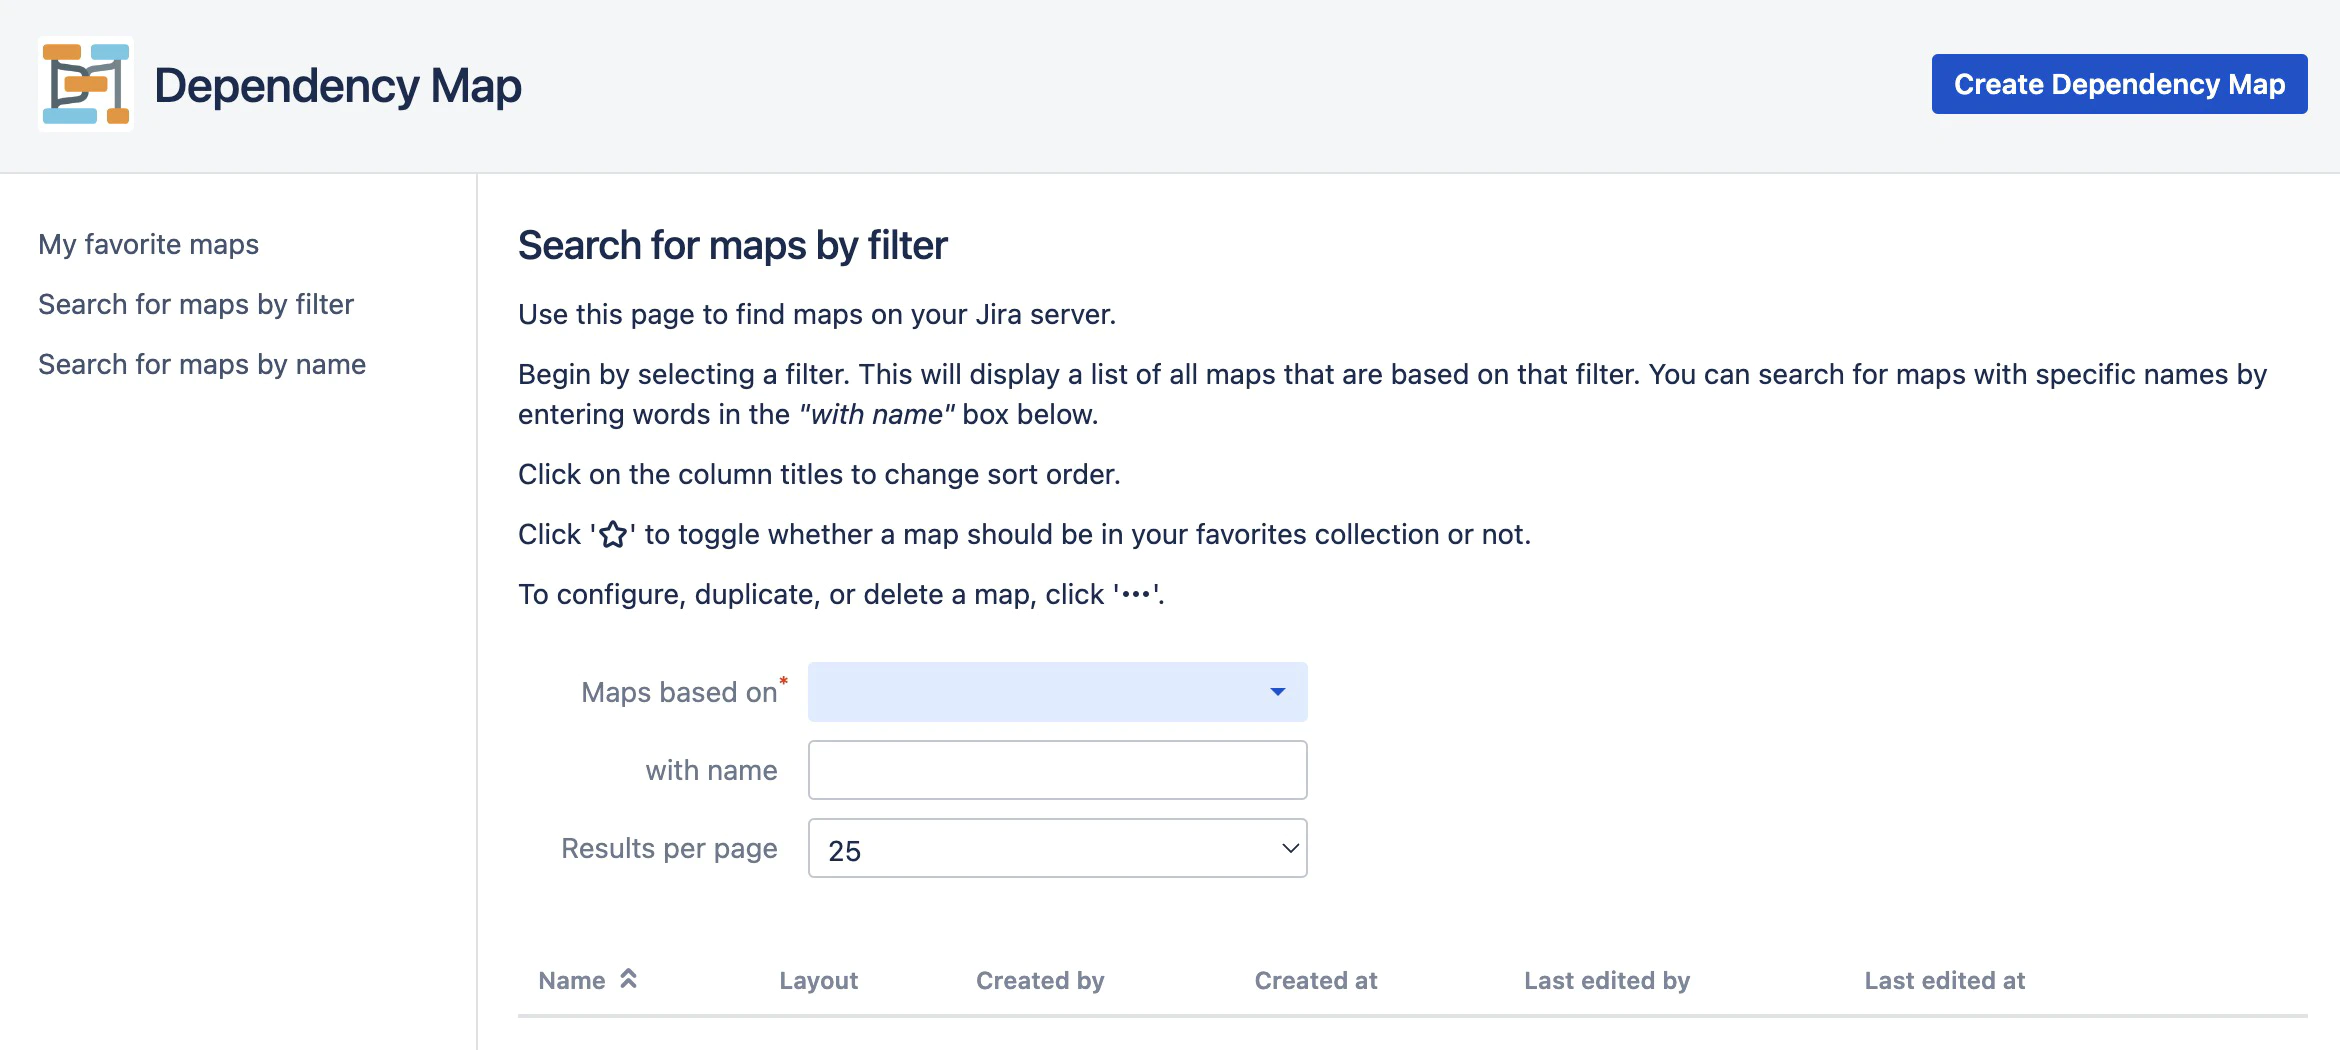
Begin by selecting a Jira filter. This will search your Jira server for all dependency maps that are based on this filter. The result is presented in the list below.
You can narrow the list to maps with a specific name by entering text in the “with name” field.
Use the “results per page” selection to choose how many maps per page to display.
You can re-order the search results by clicking on the column names. For example, to order the results by (ascending) creation date, click “Created at”. An arrow will be shown next to the column to remind you of how the list is sorted. Click the column name again to reverse the sort order.
- To add a map to your list of favourites, click the star. Maps with filled-in solid stars are in your favourites list.
- To create a new map, click the “Create Dependency Map” button in the top right corner of the page.
- To view one of the maps in the search result list, click its name.
- To edit the configuration of an existing map, click the “…” button to the right of the map name and select “Configure”.
- To duplicate an existing map, click the “…” button to the right of the map name and select “Duplicate”.
- To delete an existing map, click the “…” button to the right of the map name and select “Delete”.
To search for maps based on their names, use the “Search for maps by name” tab.
Note: All dependency maps are based on Jira filters.
The visibility of a dependency map is the same as the filter it is based on. So if you create a map based on a public filter, for example, then that map will be visible to all users on your Jira server. To limit the availability of a dependency map to a specific set of users or user groups, set the availability of the filter accordingly.
Favourites
The Favourites page looks like this:
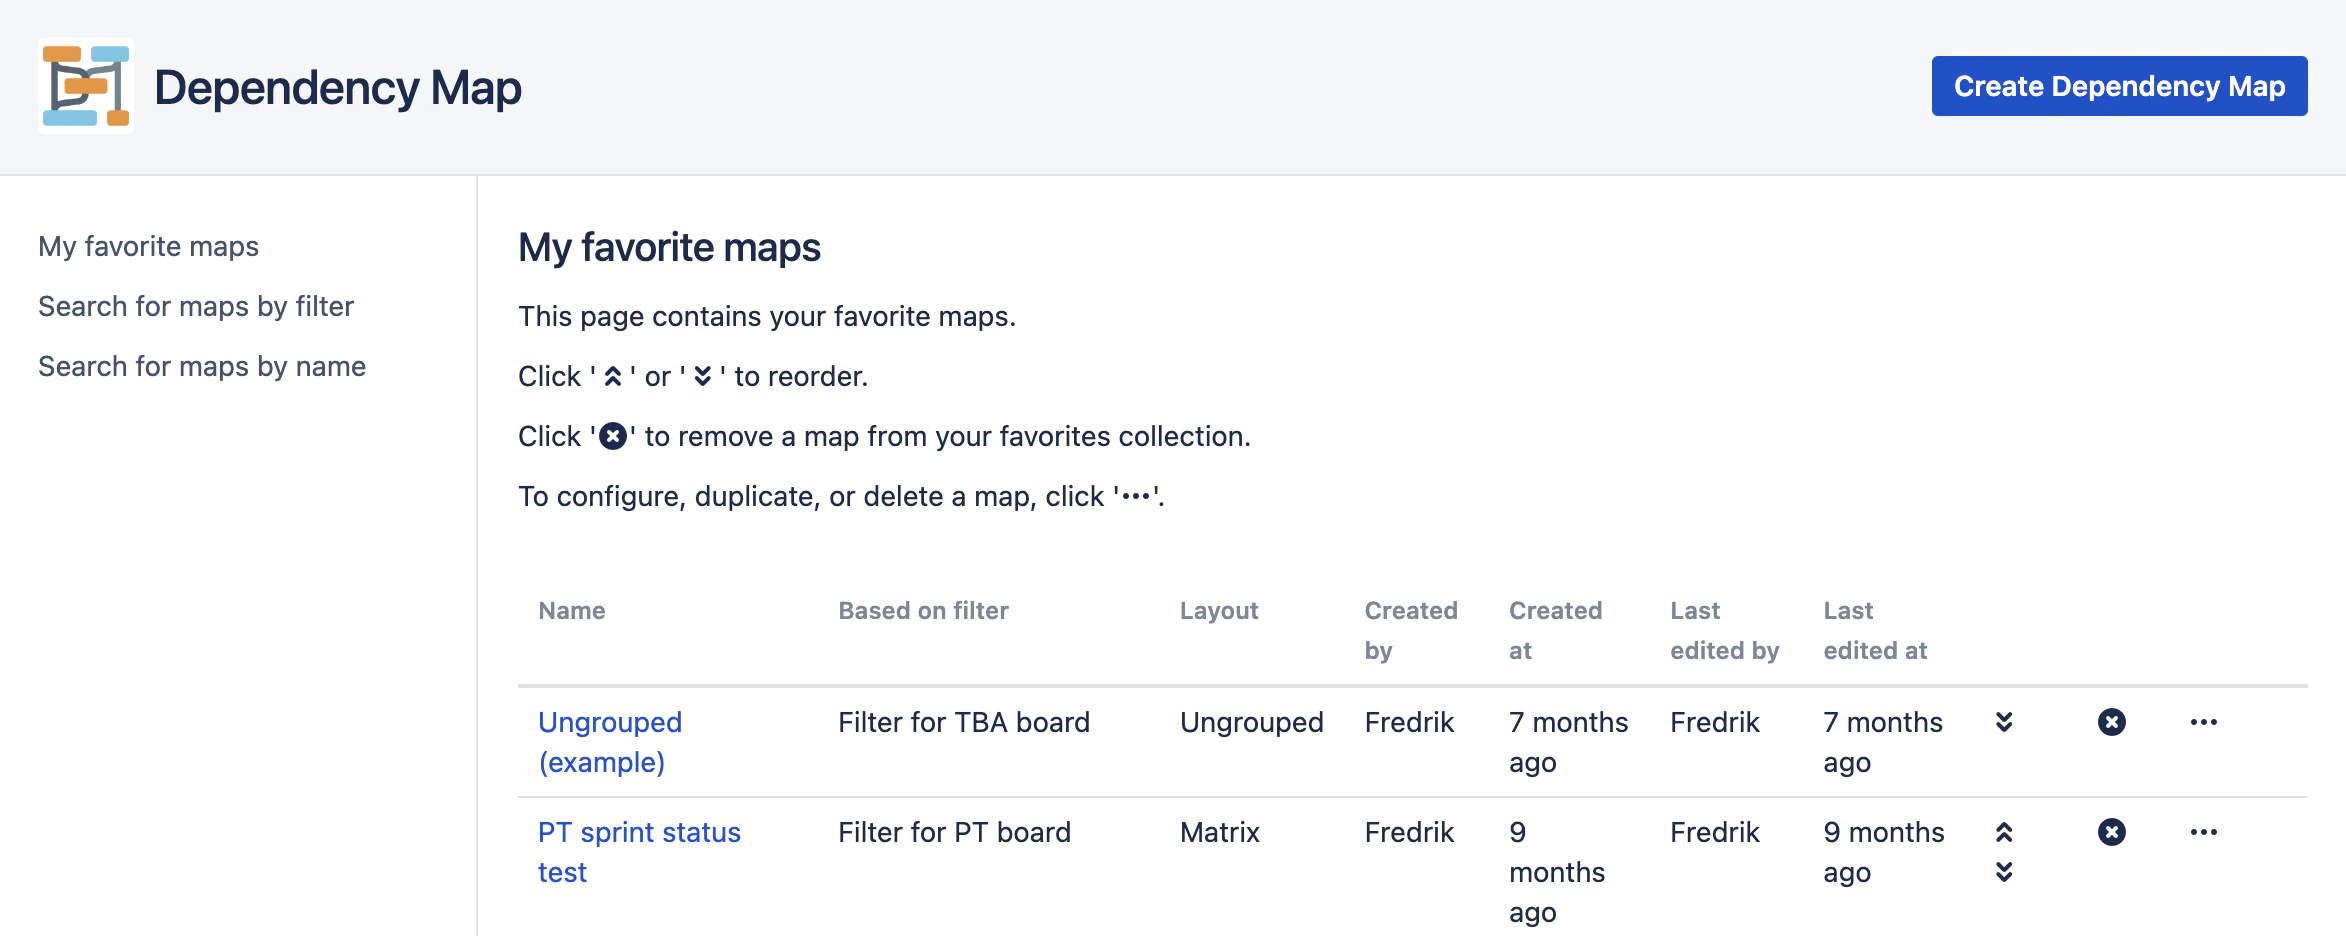
Each Jira user has their own personal list of favourite dependency maps.
- To view one of the maps in the list, click its name.
- To move a map up in the list, click the up-arrow. To move it down in the list, click the down-arrow.
- To remove a map from your favourites, click the round X. Note that this will not delete the map from the Jira server, only remove it from your list of favourites.
- To edit the configuration of an existing map, click the “…” button to the right of the map name and select “Configure”.
- To duplicate an existing map, click the “…” button to the right of the map name and select “Duplicate”.
- To delete an existing map, click the “…” button to the right of the map name and select “Delete”. Note that this will delete the map for all users on your Jira server!
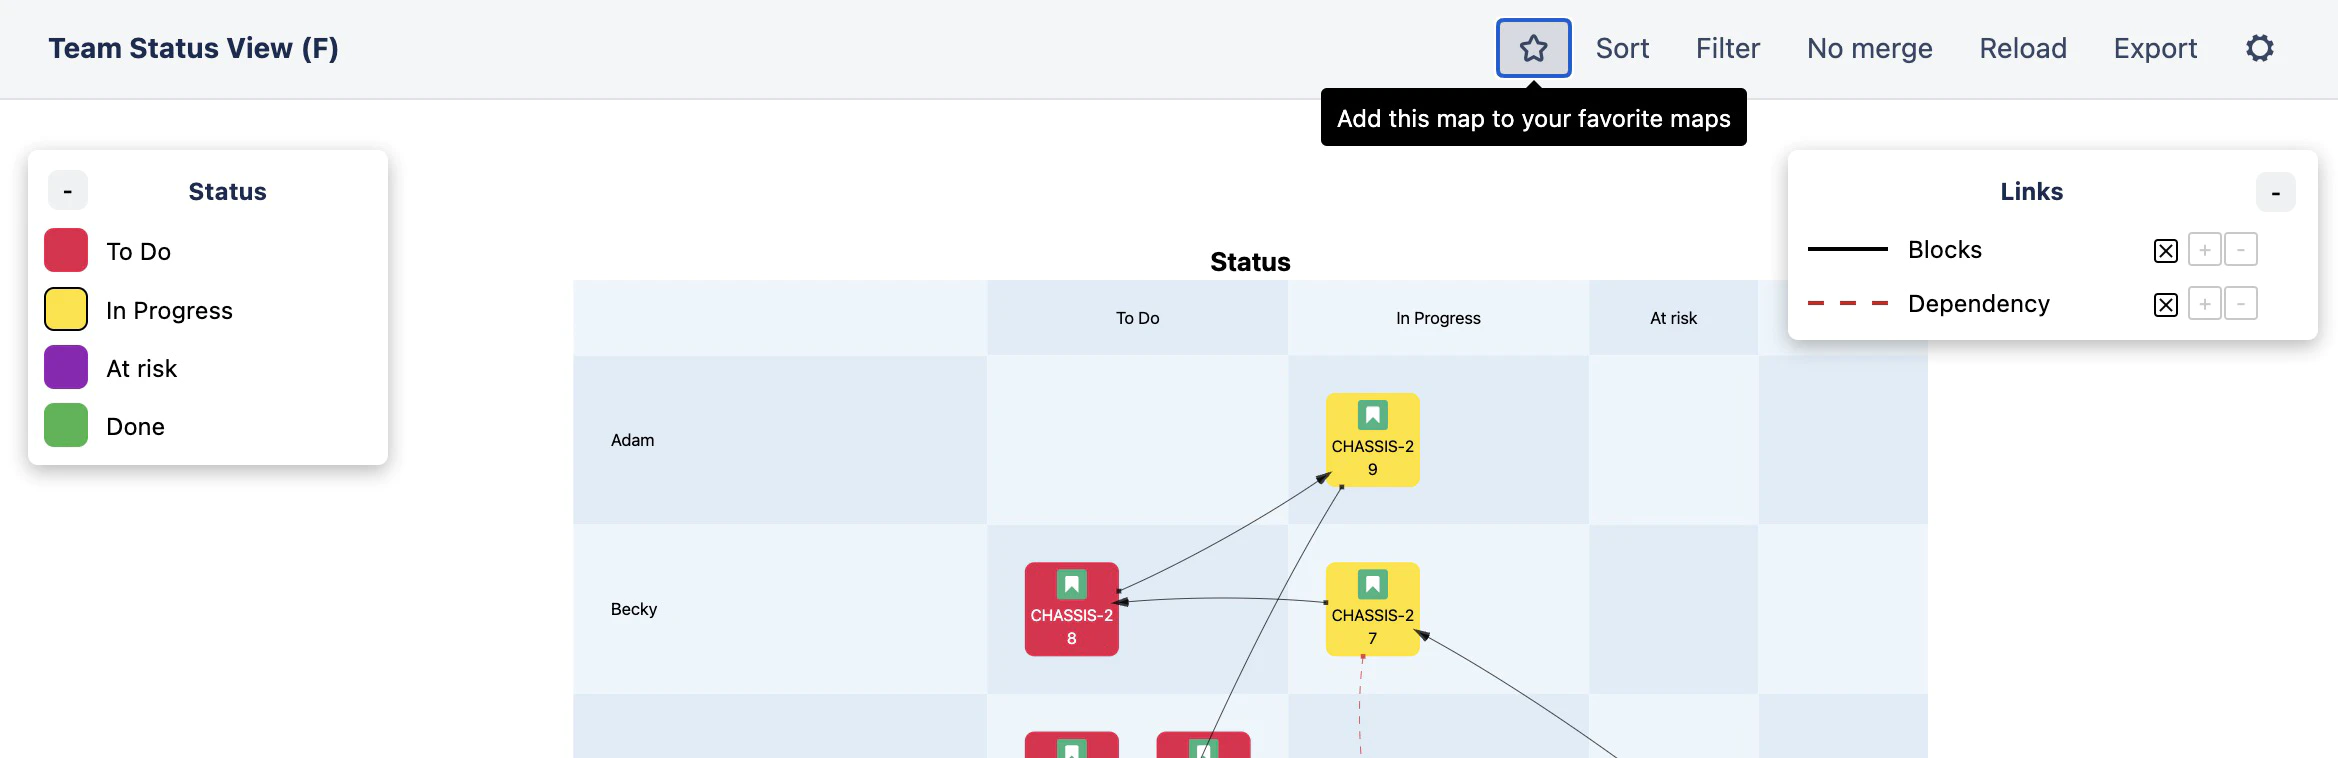
- To quickly toggle the favourite state for a map, click the star icon when viewing the map
Configuring maps
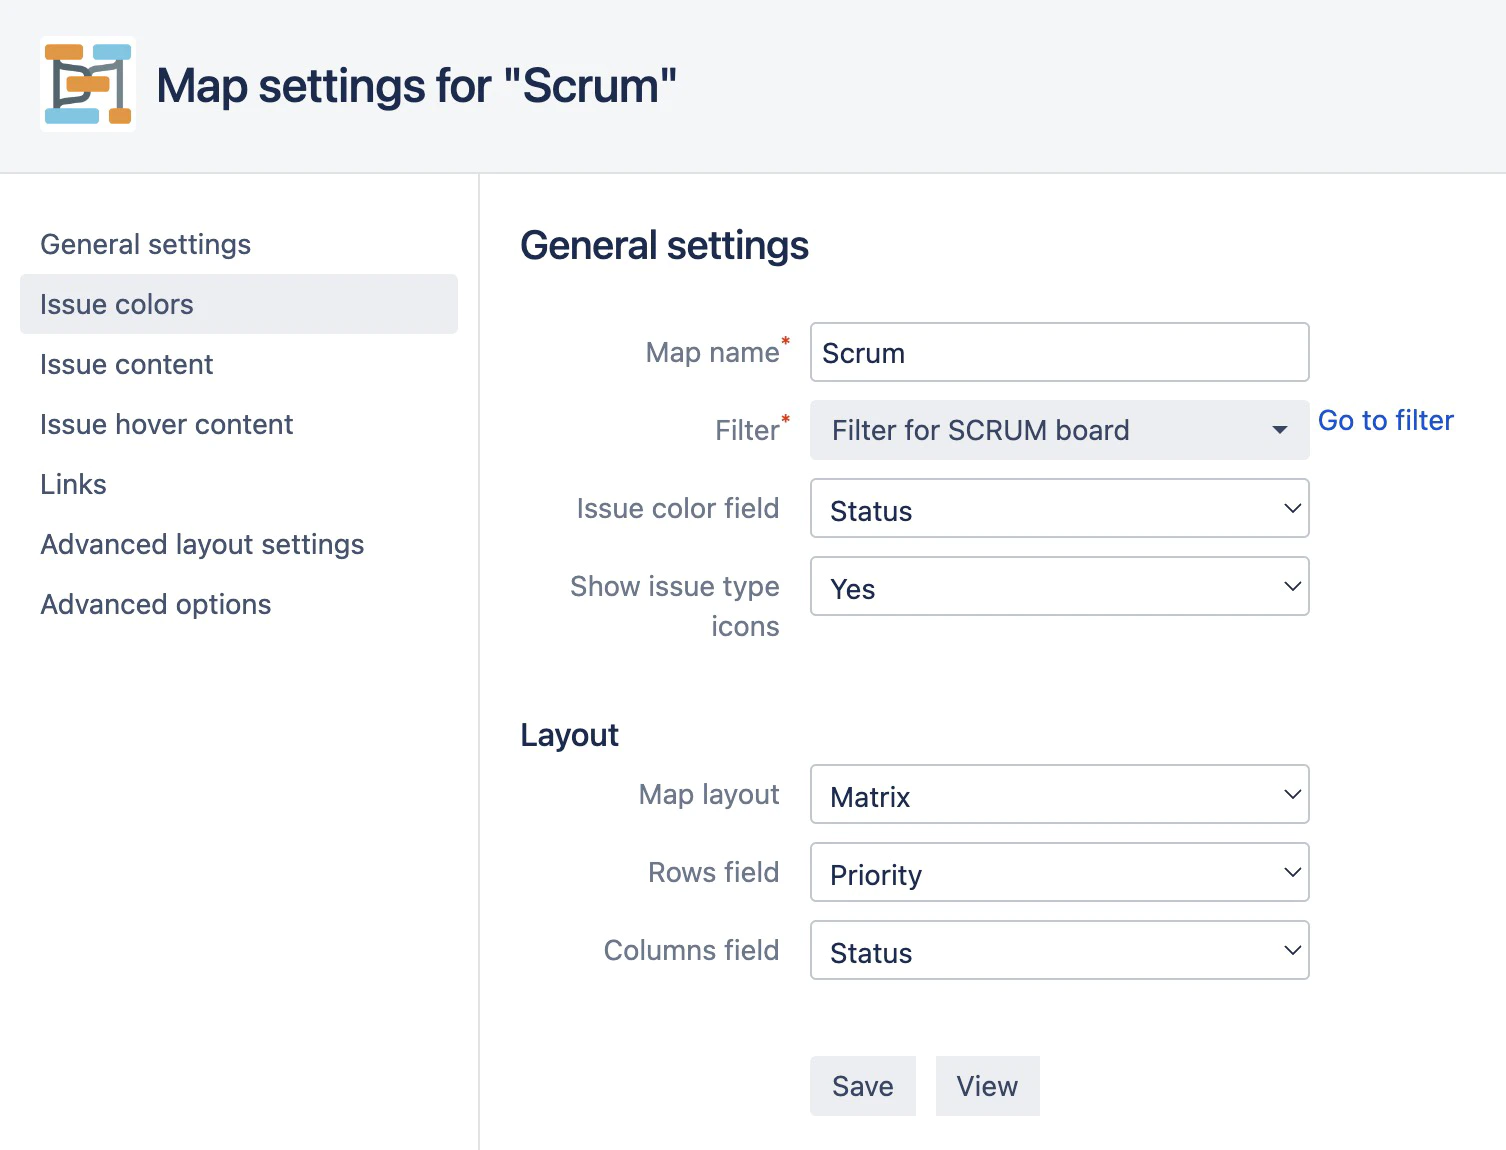
When you create a new map or edit an existing map, you will see the map configuration screen:
When you have made a change to one or several of the settings, click the “Save” button at the bottom of the page.
The “View” button will display the map.
General settings
- Map name: The name of the dependency map.
- Filter: The Jira filter that selects the issues to be drawn in the map. The link to the right opens the selected Jira filter.
- Issue color field: The field to use for issue colors in the map. For certain Jira fields, you can select the color for the field values. Click on “Issue colors” on the left of the page to go to the color selection tab (see below).
- Show issue type icons: If set to “Yes”, the issue type icon will be displayed on each issue box in your map.
Layout
- Layout: The layout to use for the map. The various layouts are described in more detail below.
- Group by (“Sections” layout only.): Group issues in the map based on this field.
- Rows/Columns (“Matrix” layout only.): The fields to use for matrix rows and columns in the map.
If you click the “Advanced layout settings” tab on the left of the page, you will gain access to options that allow you to simplify and merge groups and rows/columns in your diagram. These options are described in more detail below.
Selecting issue colors
Clicking on “Issue colors” on the left of the page opens the issue color tab:
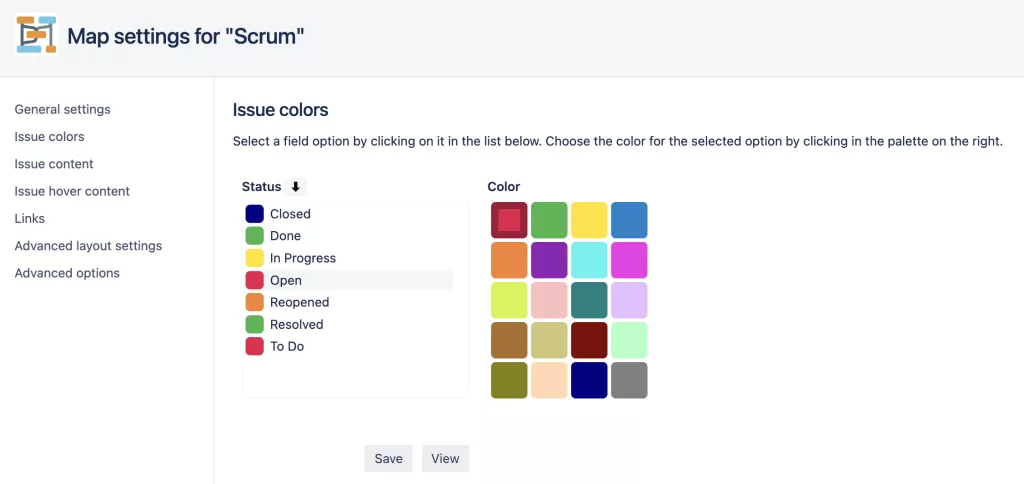
Click on a field value in the list on the left, then click one of the colors on the right to select the color the value should have in the map.
The list of values can be sorted by clicking the button next to the field name (here Status).
Click Save when done customizing the colors.
Configuring link types
Clicking on “Links” on the left of the page opens the links tab:
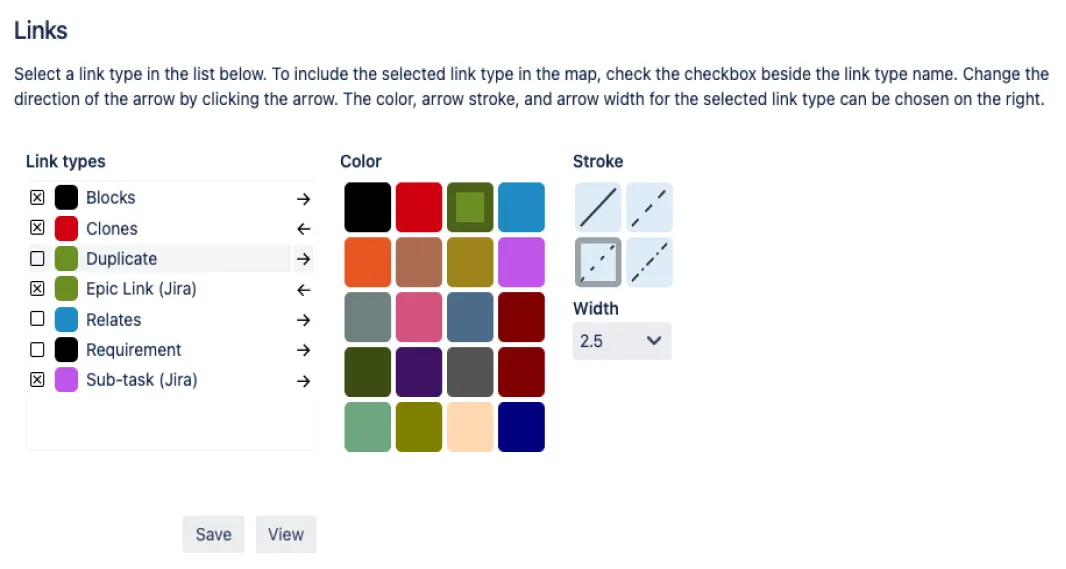
To select a link type for editing, click its name in the list on the left.
Use the small ‘x’ button to the left of the link type name to choose whether links of this type should be included in the map.
Click the small arrow button to toggle between “forward” or “reverse” direction of the link.
Click on one of the colors on the right to select which color the selected link type should have in the map.
Select the line stroke and line width in the same way.
The “Sub-task (Jira)”, “Epic Link (Jira)”, and “Parent (Portfolio)” link types are special, in the sense that they are not ordinary Jira links. Instead, they represent relations that are hard-coded into Jira and Portfolio.
- Sub-task (Jira): This relation connects stories (or tasks) to sub-tasks.
- Epic Link (Jira): This relation connects epics to stories (or tasks). (This type of link is only available in Jira if the application “Jira Software” has been installed.)
- Parent (Advanced Roadmaps): This relation connects higher-level epics (such as initiatives) with epics. (This type of link is only available in Jira if the “Advanced Roadmaps” add-on has been installed.)
Configuring issue content
Clicking on “Issue content” on the left of the page opens the issue content tab, where you can select what to show in the issue boxes in your map.
To include a field, drag it from the left list to the right list. (You can also use the arrow buttons.)
Drag the fields in the right list to rearrange them.
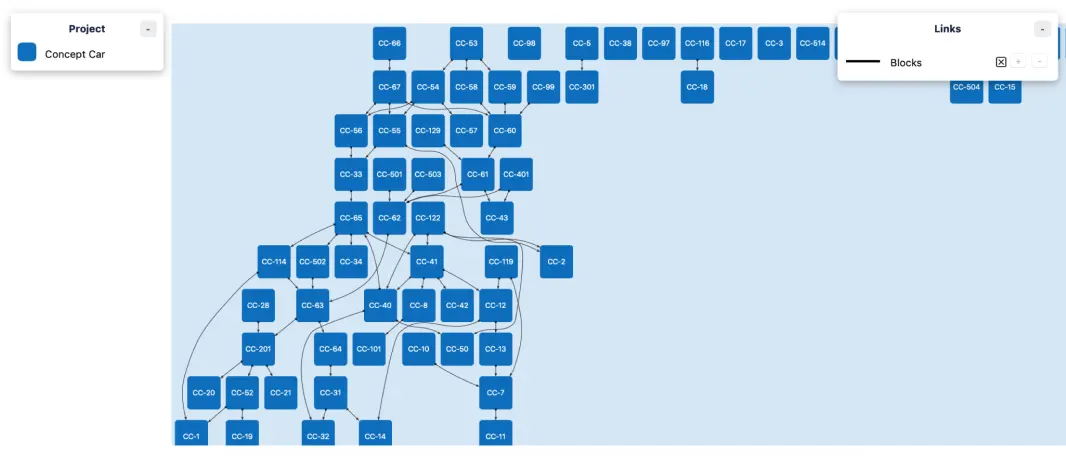
Ungrouped layout
This layout attempts to keep all issues at a similar distance from each other and organizes the issues so that link arrows point downwards or sideways, when possible.
Note: If your map contains more than ~300 issues, Dependency Map will automatically switch to a 1-column/1-row Matrix layout. The reason is that Ungrouped layout code has exponential computational complexity, which could cause the computation to take minutes or even hours to complete.
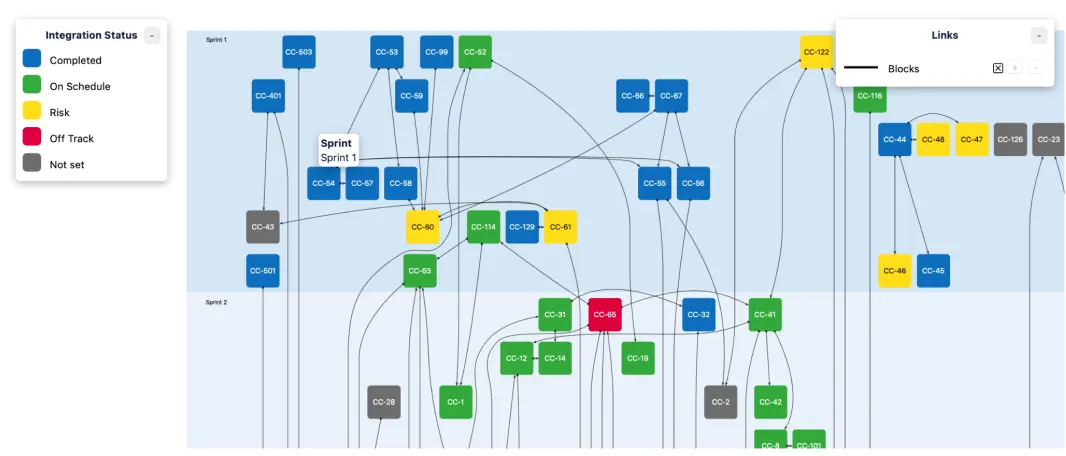
Sections layout
This layout organizes issues in groups according to the issue field that you selected, while attempting to avoid overlapping arrows.
Note: If your map contains more than ~300 issues, Dependency Map will automatically switch to a 1-column Matrix layout. The reason is that Sections layout code has exponential computational complexity, which could cause the computation to take minutes or even hours to complete.
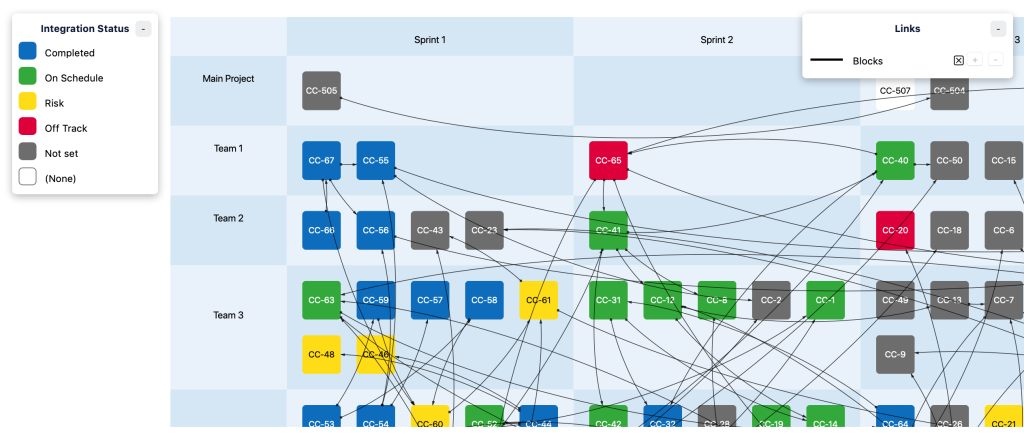
Matrix layout
This layout uses two fields to group the issues into a matrix.
Simplifying and changing group names using regular expressions
Clicking on “Advanced layout settings” to the left of the config page navigates to a tab where you can choose advanced settings for your map, such as group filters and group merging.
For example, let’s say that you have a map with issues from two different projects and that the projects have slightly different naming conventions for the “sprint” field:
Project 1: “Project Alpha Sprint 1 190101”, “Project Alpha Sprint 2 190301”, etc.Project 2: “Increment 1 190101”, “Increment 2 190101”, etc.
You can instruct Dependency Map to search-and-replace patterns in the field values for the second project so that they match the first project. To do this, click on the “Edit search/replace” button. This will open a dialog where you can enter a regular expression to search for, and the string to use as replacement.
Using
Increment
as the search regex and
Project Alpha Sprint
as the replacement will cause the field values to match.
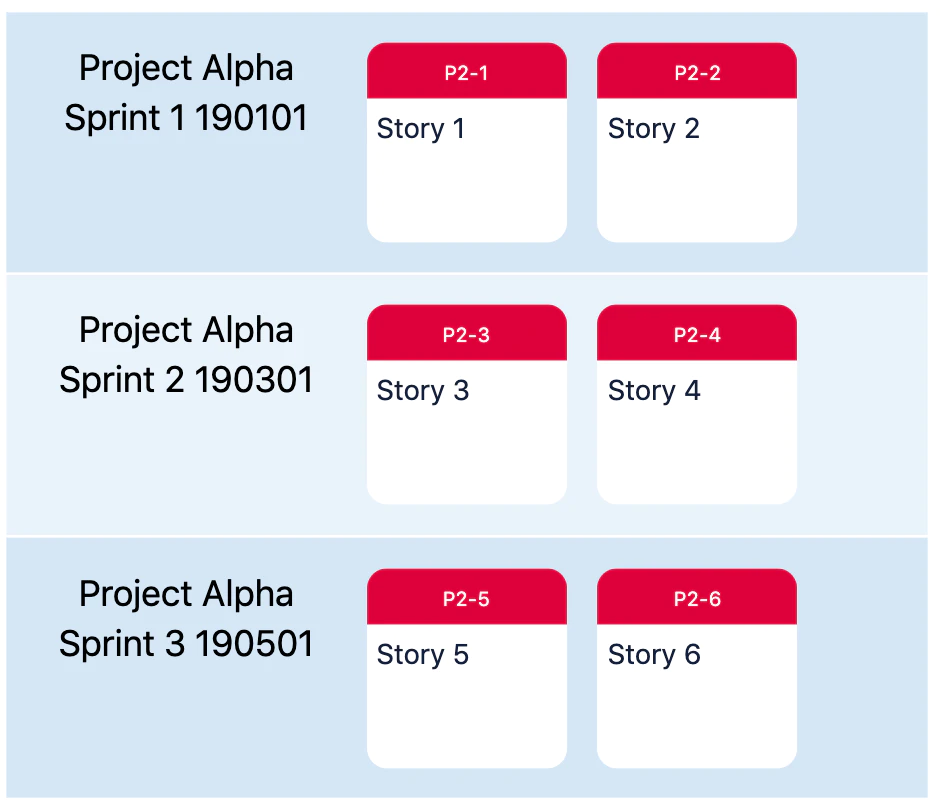
We can also simplify field values to make them easier to read. For example, let’s say that we have the following sprint names:
Project Alpha Sprint 1 190101
Project Alpha Sprint 2 190301
Project Alpha Sprint 3 190501
and we group by the “sprint” field in a “Sections” layout in dependency map:
To simplify the labels, we can enter this regular expression as the “extract regex” for the sections:
Sprint d*
This regular expression will match the characters Sprint, a space, and any number of numerical digits after the space.
The result is:
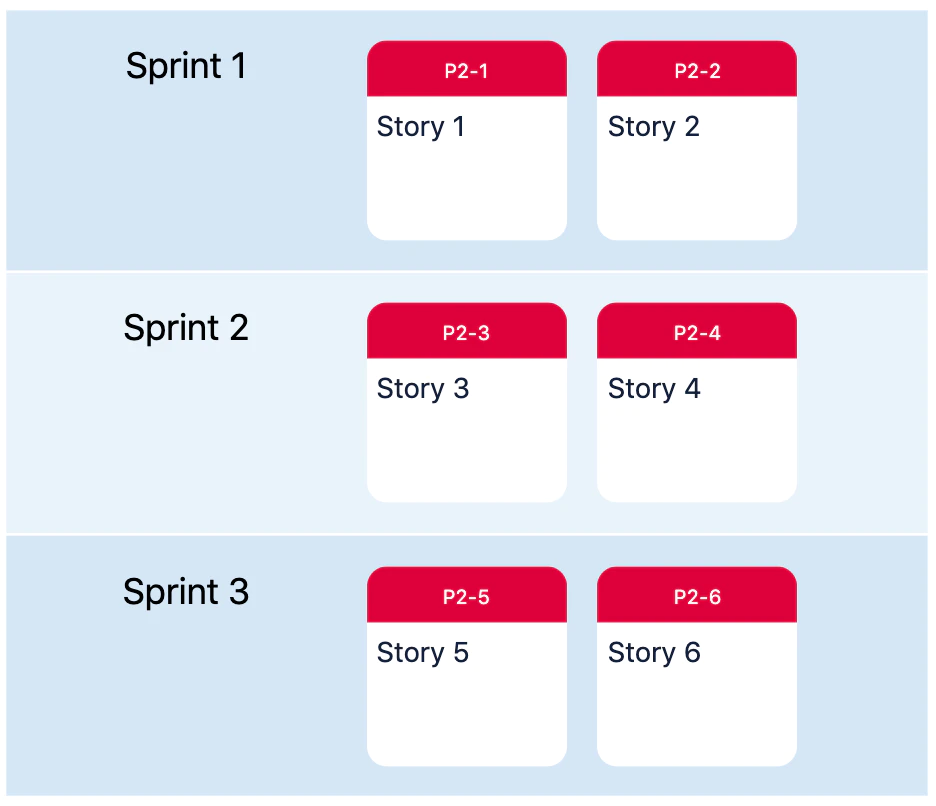
which is much easier to read.
If the result of applying the regular expression is empty, then Dependency Map will use the original field value. Also, Dependency Map will ignore uppercase/lowercase differences when applying the regular expression by default.
So with the regular expression we used in the example above, the sprint names
Project Alpha Sprint 1 190101
Project Alpha SPRINT 2 190301
Project Alpha sPrInT 3 190501
will result in the following diagram labels:
Sprint 1SPRINT 2sPrInT 3
If we set the option “Sections regex case sensitive” to “Yes”, however, we get the following result:
Project Alpha Sprint 1 190101
Project Alpha SPRINT 2 190301
Project Alpha sPrInT 3 190501
In this case, the regular expression will match the first label. Applying the regular expression to the other two labels produces an empty result, so they keep their original names.
To learn more about regular expressions and how to create an expression that matches your specific use case, please see Learn Regex: A Beginner’s Guide.
You can also try out your regular expressions at: Regular Expressions 101.
Please note that Dependency Map uses the “Javascript” flavour of regular expressions.
Merging groups
It is sometimes useful to merge together groups in the diagram.
For example, let’s say that we have a large-scale project with 4 teams: Alpha, Beta, Delta and Gamma, and that each team has its own Sprint Board in Jira. Let’s also assume that we have organised the work so that all sprints are synchronised: the start and end dates for the sprints are the same for all teams.
When we create a dependency map for the project (in this case, a program board matrix), the default behaviour is to show each sprint as a separate column:
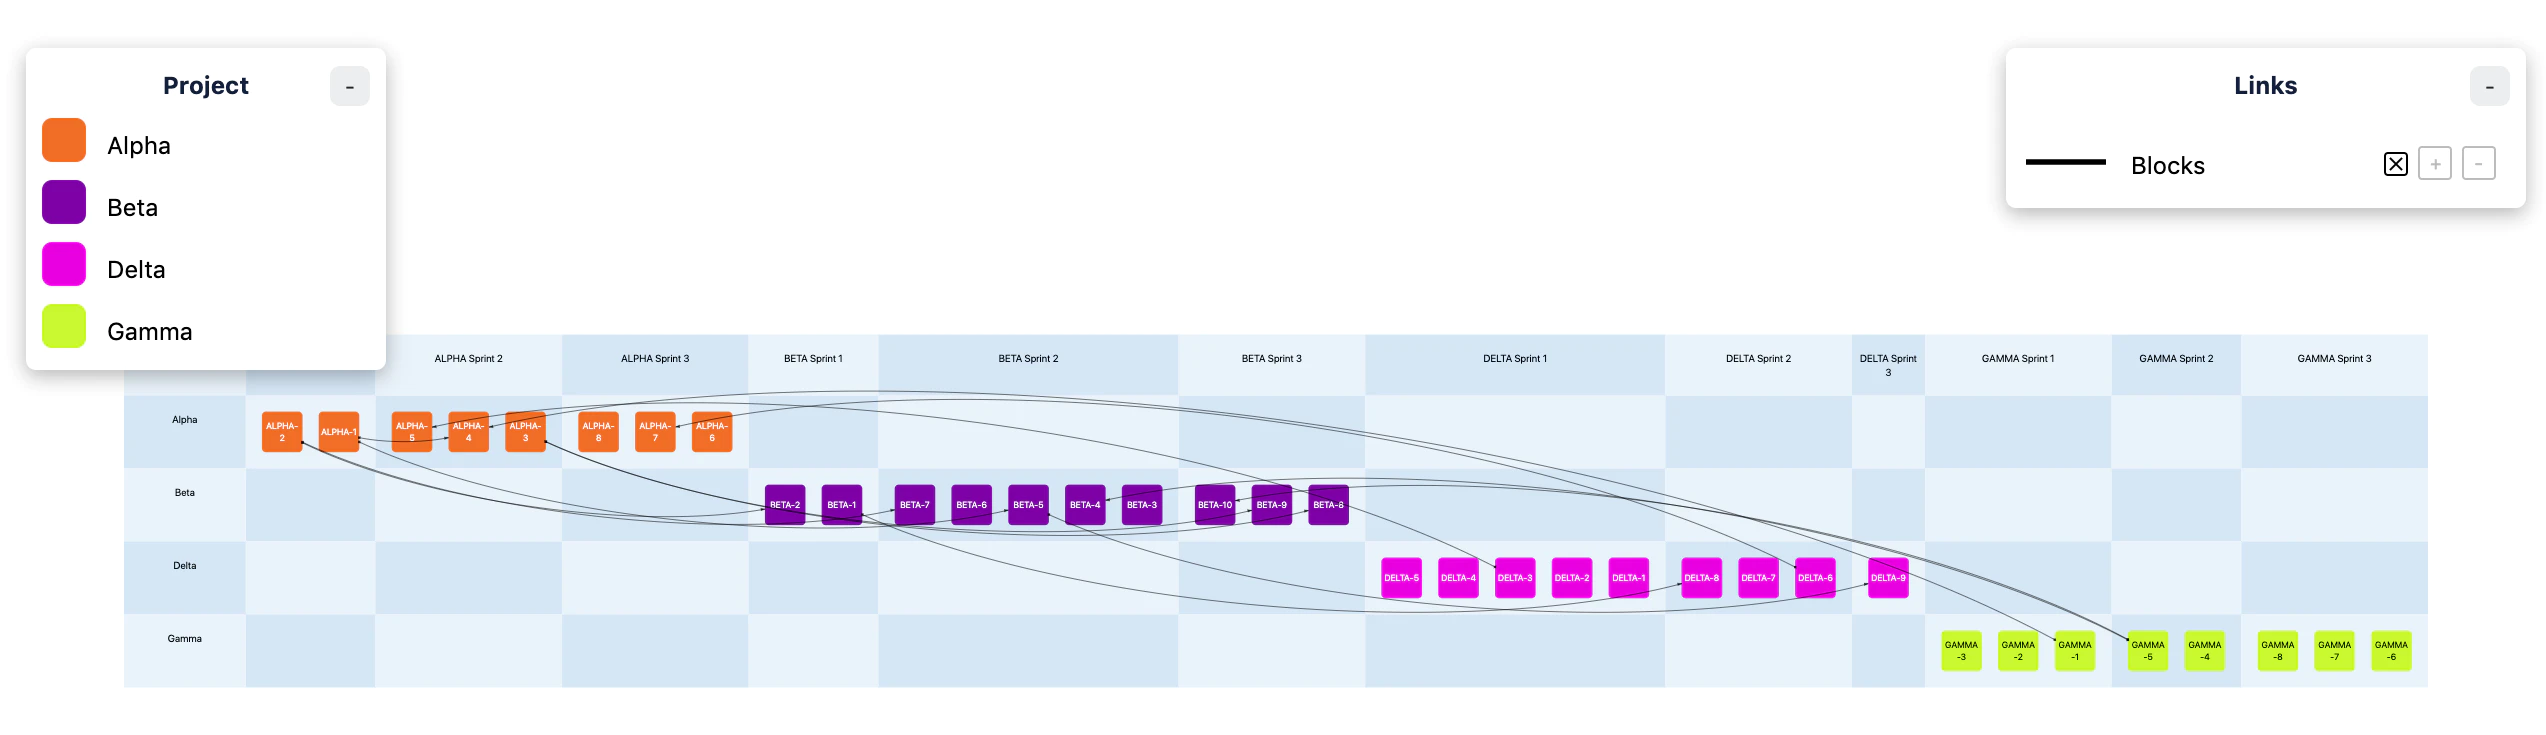
Since every sprint has its own value in the “sprint” Jira field, the diagram gets one column for “ALPHA Sprint 1”, one for “BETA Sprint 1”, one for “DELTA Sprint 1”, and so on. The result is difficult to interpret since the columns do not form a “continuous” timeline in the diagram.
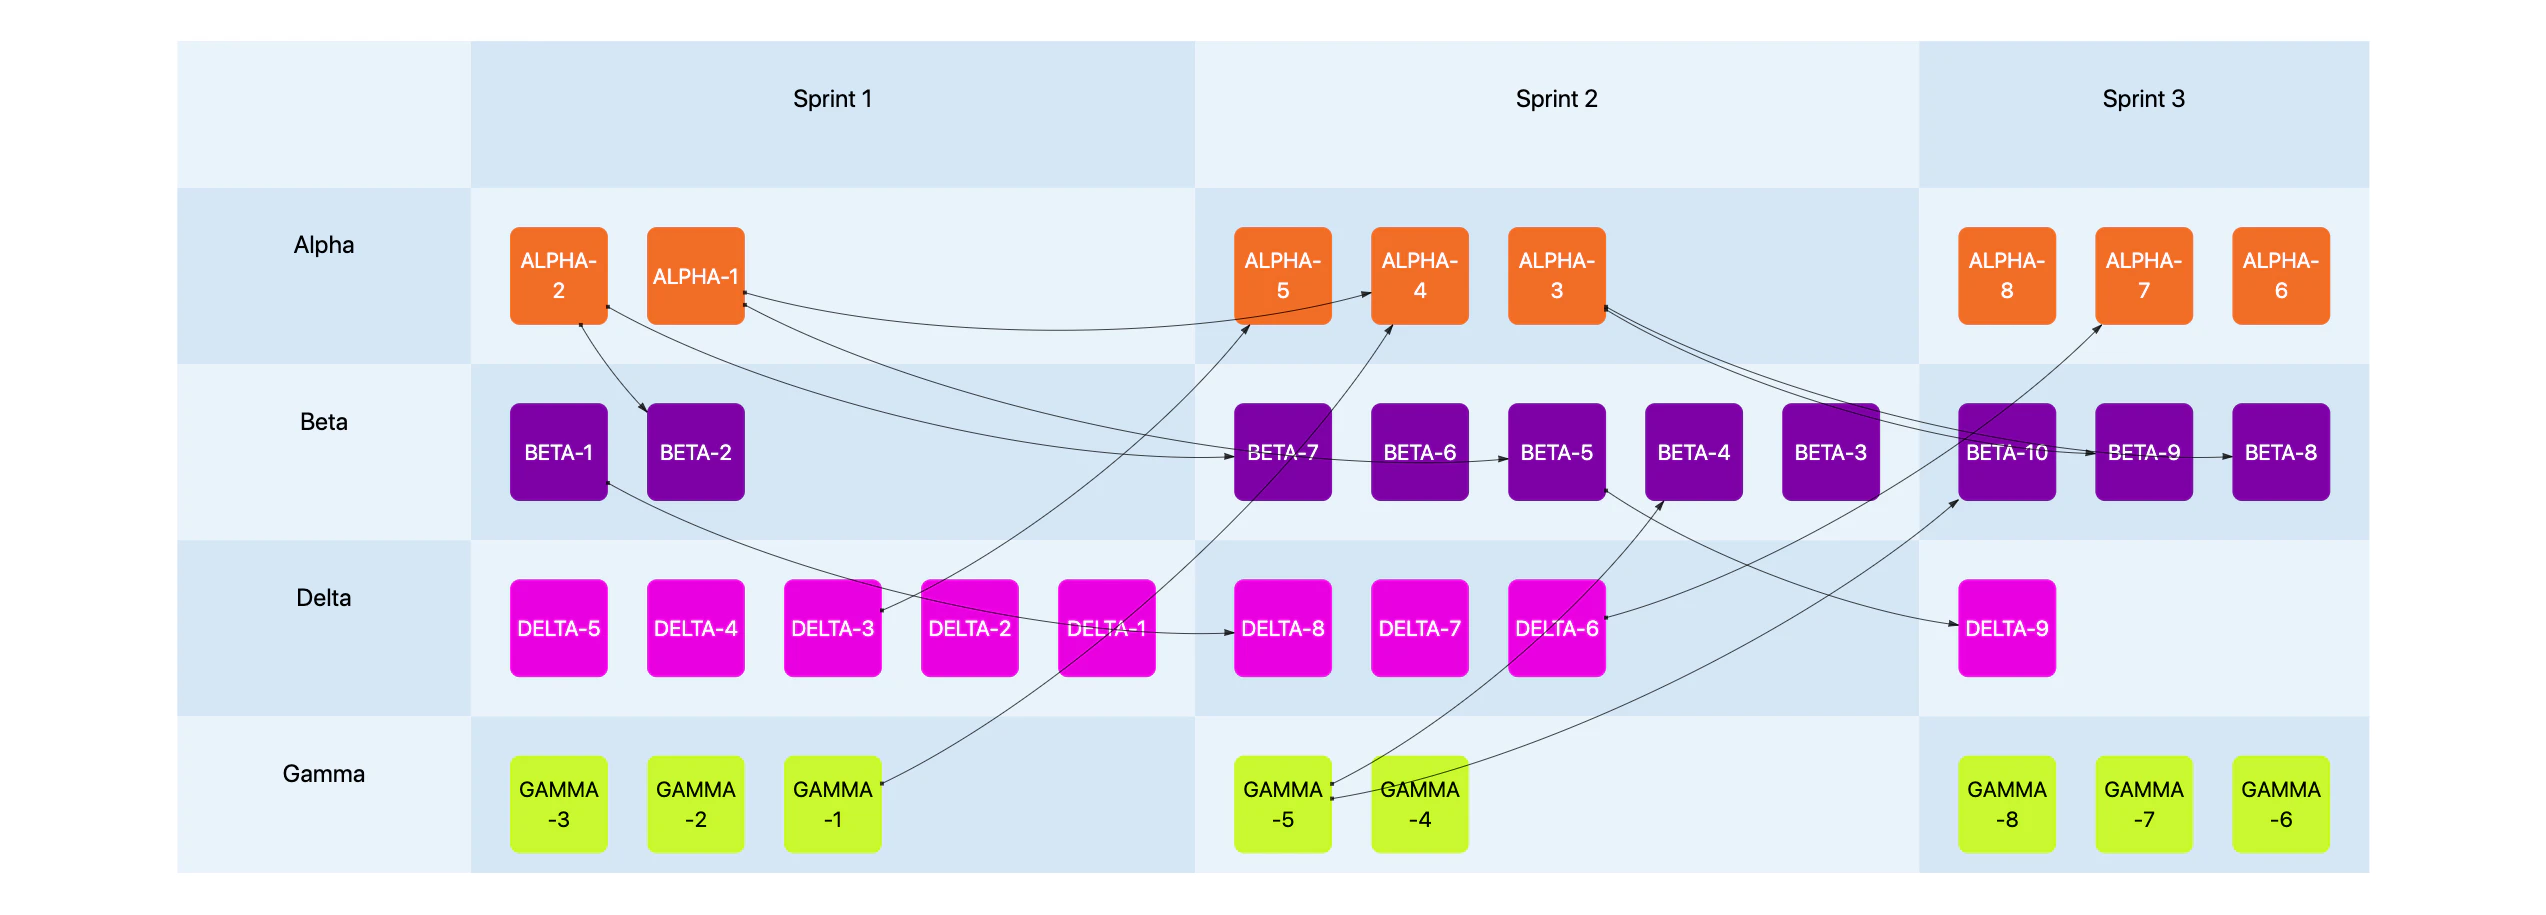
To solve the problem, we can configure the dependency map so that the columns are merged: Sprint 1 for all teams becomes the first column, Sprint 2 for all teams becomes the second column, and so on:
To do this, we first configure Dependency Map to use the same regular expression as above for the columns to extract the sprint names:
Sprint d*
So, for example,
ALPHA Sprint 1
becomes
Sprint 1
We then activate column merging by setting the “Merge columns” option to “Yes” in the dependency map configuration:
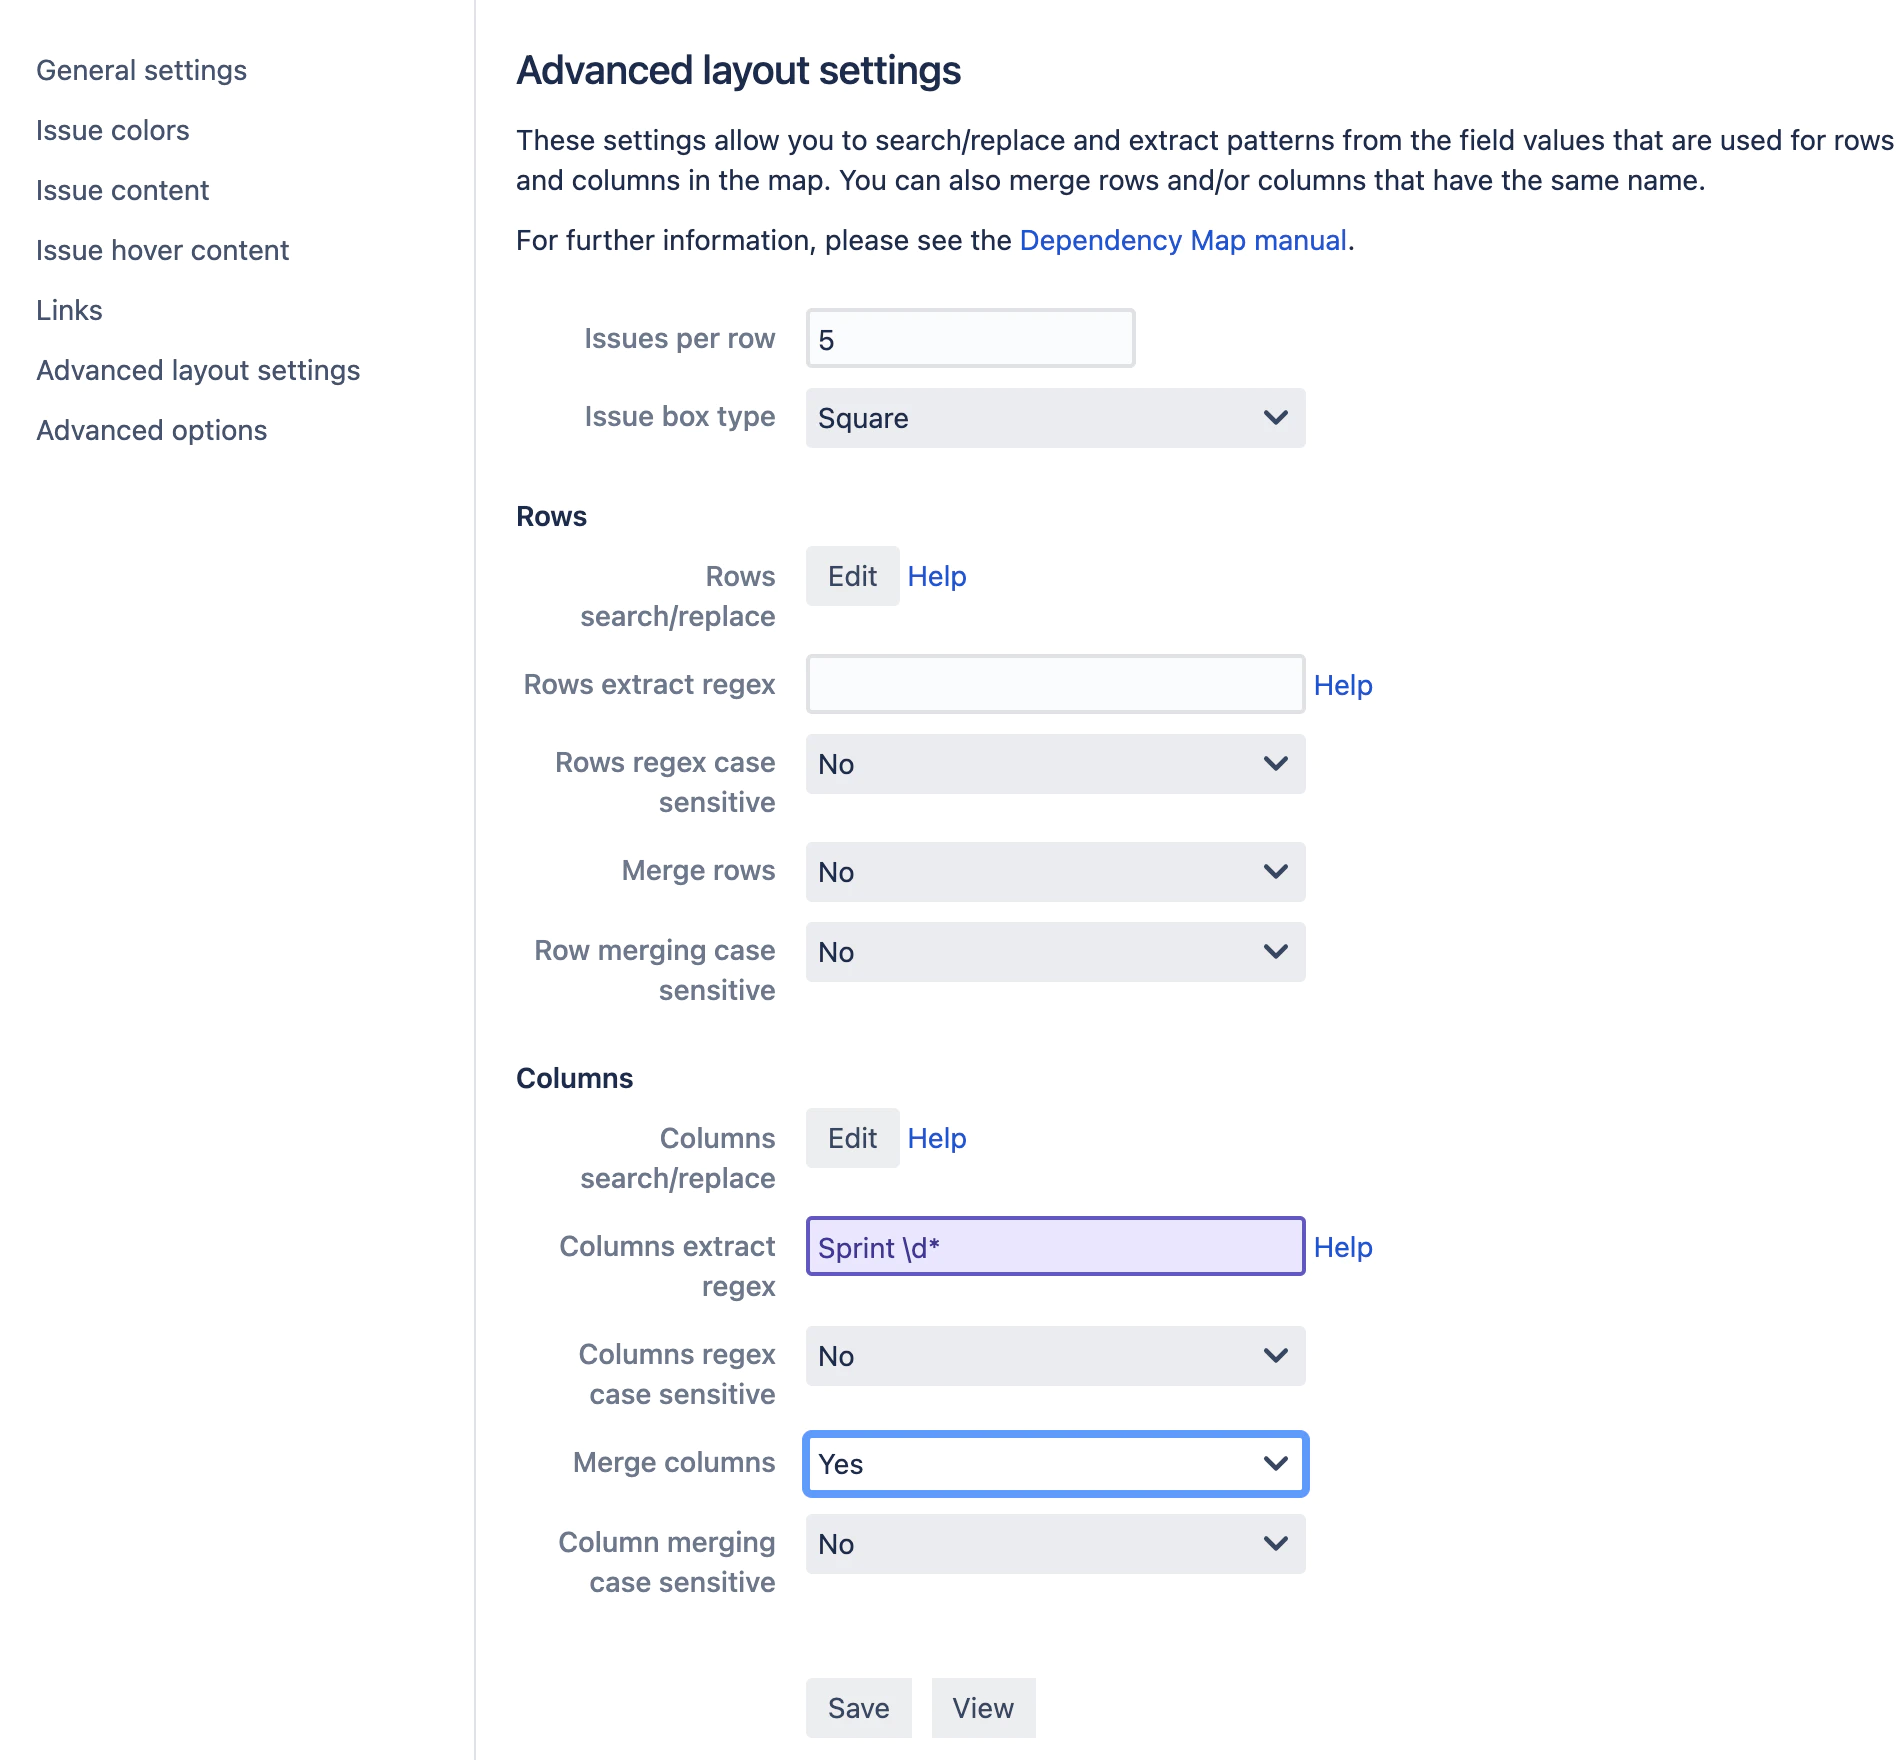
By default, the merging will ignore uppercase/lowercase differences so that, for example, “SPRINT 1” will be considered equal to “Sprint 1”. You can instruct Dependency Map to take case differences into account by setting “Column merging case sensitive” to “Yes”.
Advanced options
Clicking the “Advanced options” on the left of the config page navigates to a tab where you can choose additional advanced settings for your map.
Parallel loading of issue batches
When an app loads issues from Jira, it can only load a certain number of issues at a time. By default, Dependency Map fetches issues in batches of 50.
For large maps, which can contain several hundreds of issues, this can cause long loading times. To solve this, this map option allows you to choose whether to fetch 1, 2, 3 or 4 issue batches in parallel.
For example, setting this option to “2” instructs Dependency Map to fetch up to two issue batches simultaneously, which may cut the loading time in half. However, the downside of doing this is that this places a larger strain on your Jira server, since Dependency Map now issues two issue fetch operations at once rather than one (which is the default).
Therefore, we recommended to keep this setting at its default value of “1”, unless your map contains a large number of issues.
Link following
All Dependency Maps are based on a Jira filter. When a Map is loaded, the filter will return a list of issues to display in the Map.
Sometimes, however, you may want to include issues that are linked to/from those returned by the filter. For example, let’s say that you have a Map based on the Board filter of your Jira Project. This will display all issues in your project, but dependencies to/from other projects will not be included (since those issues are not covered by the filter).
To solve this, you could create a new filter that adds all issues from those projects, but that will result in a Map that displays issues that you aren’t interested in. A better option is to use the Follow links option (which can be found under the “Advanced options” tab on the config page for your Map).
The following image illustrates how it works:
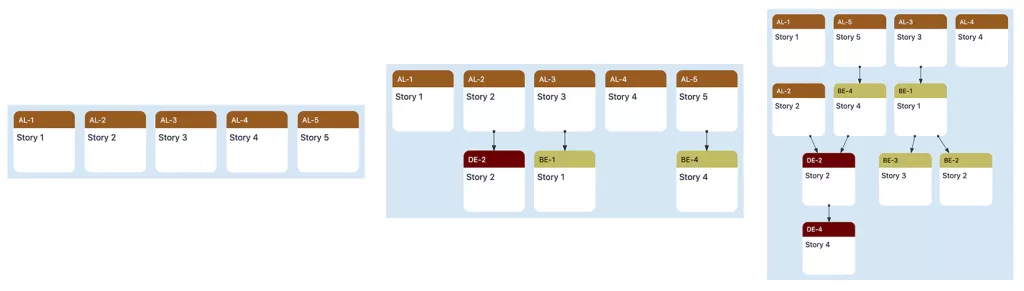
When “Follow links” is set to 0 (the default value), you get a Map similar to the one on the left: only the issues returned by the filter are included. If you set “Follow links” to 1, you get the result shown in the center: links to/from the issues returned by the filter are included. If you set “Follow links” to 2, you get the result on the right: here, the “secondary” issues have been examined and links to/from those have been included.
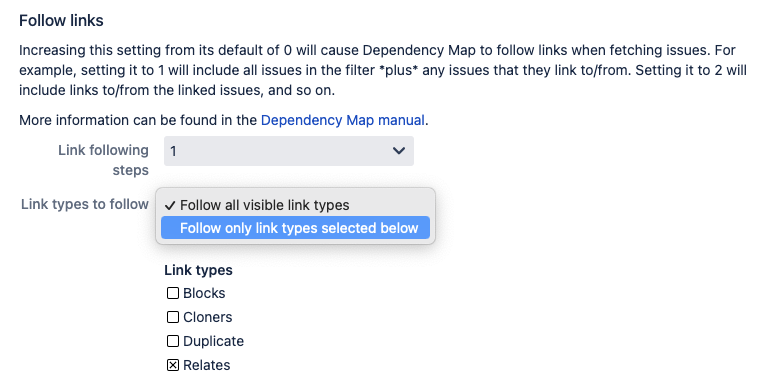
The “Link types to follow” allows you to choose between “Follow all visible link types” and “Follow only link types selected below”.
- With “Follow all visible link types” the link types selected in the “Links” settings are followed.
- With “Follow only link types selected below” the link types selected here are followed, which allows you to follow other link types than the ones you visualize in the map.
Note: If your map contains more than ~300 issues, Dependency Map will automatically switch to a 1-column Matrix layout. The reason is that Sections layout code has exponential computational complexity, which could cause the computation to take minutes or even hours to complete.
Note: The link following feature currently only works for Jira links. Epic Link and Advanced Roadmap Parent links are not followed.
Displaying the sum of a numeric field
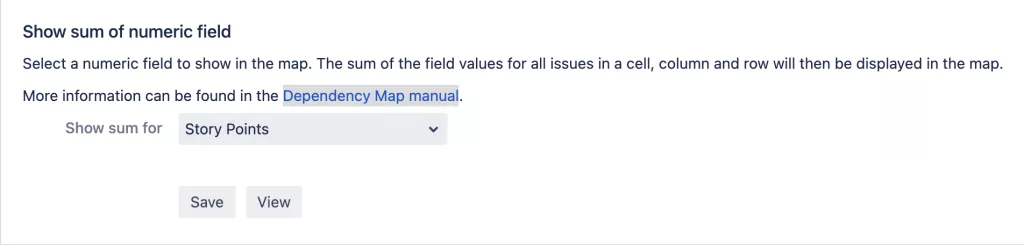
The sum of a numeric field can be displayed in the map, where the sum of the field values for the issues in each cell, column and row will be displayed.
The following image illustrates how it works. In this example, “Story Points” has been selected.
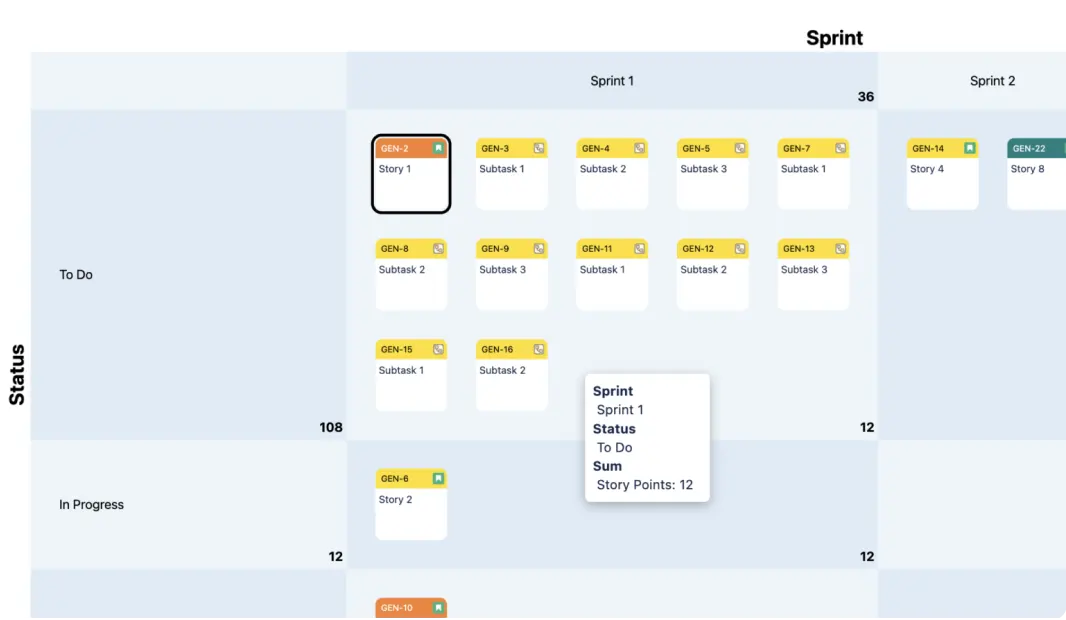
Enable this feature in the Advanced options settings by selecting a numeric field in show sum of numeric field. Displaying sums are supported in the Matrix and Sections layouts.
Closed sprints
When completing a sprint, issues which are incomplete can either be moved to the backlog or to a future or a new sprint. This leaves a trail of which closed sprints the issue has been part of.
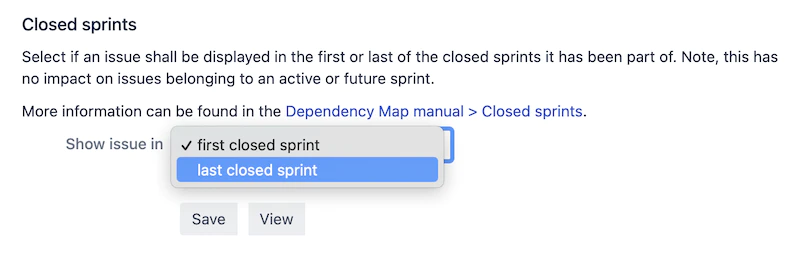
When an issue is completed, the setting for “Closed sprints” controls whether the issue shall be displayed in the first (oldest) or last (newest) of the closed sprints it has been part of. If the issue still belongs to an active or future sprint, it will be displayed in that sprint.
The following screen recording illustrates how it works (click to start it).
Sprint 1, 2 and 3 are closed (completed). The issue (GEN-2) is also completed (Done) and has been part of all three of the closed sprints. By changing the setting “Show issue in” to “last closed sprint”, the issue is displayed in Sprint 3 instead of Sprint 1.
Select show issue in first/last closed sprint in the advanced options settings:
How to work with a dependency map
Once the map is shown, you can navigate it using your mouse and/or trackpad.
- To pan, click the left mouse button and drag (or use the pan gesture on your trackpad).
- To zoom, use the scroll wheel (or pinch gesture on your trackpad). If you zoom in far enough you will see the Summary of the issue, instead of just the issue key.
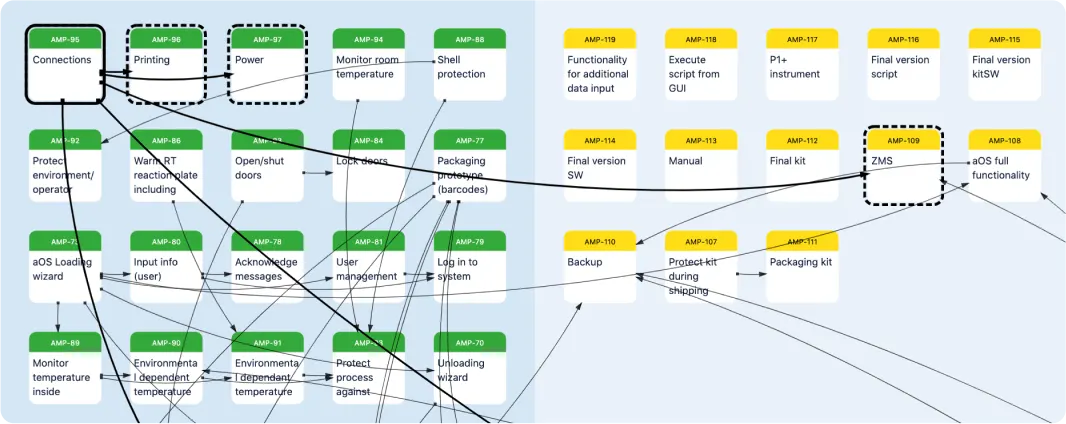
- To select an issue, click on the issue. To select additional issues, hold shift and click on the issues. In addition to highlighting the selected issues, Dependency Map will also highlight their links, and any linked issues:
- To select multiple issues, hold shift and drag.
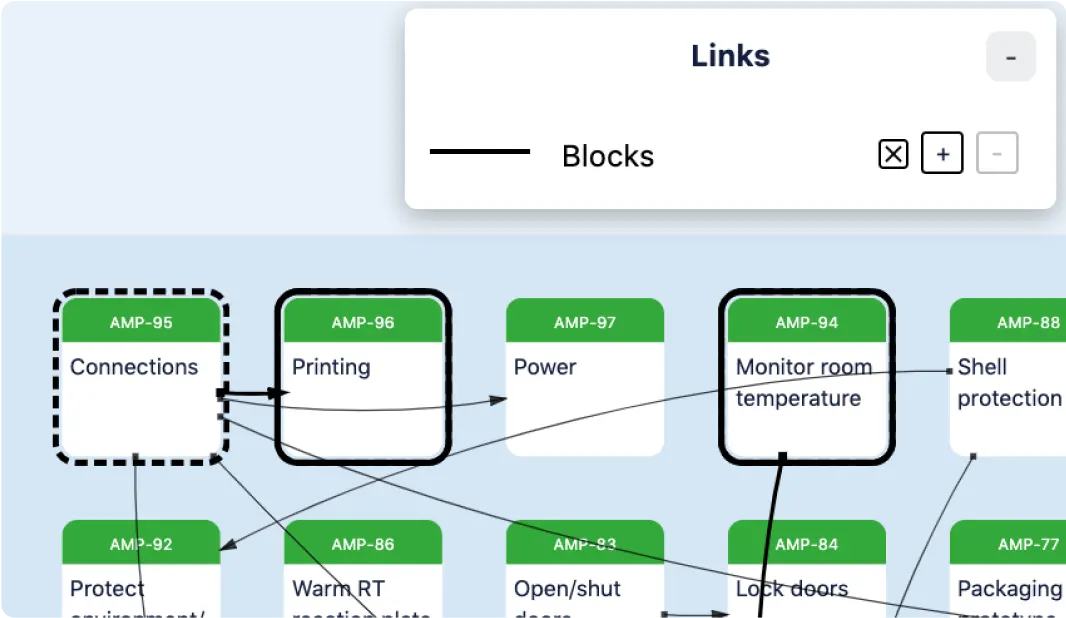
- To create a link between two issues, first select the issue you would like the link to start from. Then select the issue you would like the link to go to (via shift-click). Then press the ‘+’ button next to the type of link you want to create (in the upper right corner):
- To delete a link between two issues, first select the issue that the link starts from. Then select the issue that the link goes to (via shift-click). Then press the ‘-‘ link button next to the type of link you want to delete (in the upper right corner).
- To show or hide the color legend and/or the Link boxes, click the small ‘+’ button at the top right of the boxes.
- To show or hide links, click the small ‘x’ button next to the link type in the Links box. Note that selecting issues will still highlight the links to/from those issues.
- To show information about the row/column or section you are in, hover the mouse cursor over the cell or section.
- To show information about an issue, hover the mouse cursor over the issue.
- To edit an issue in Jira’s standard issue editing dialog, select the issue, right click, and select “Edit issue…” in the popup menu.
- To move one or several issues, select the issues, right click on top of the section to where you want the issues to move, and select the appropriate option in the popup menu:
- To open an issue in Jira in a separate browser tab, double-click on the issue.
- To update/refresh the map with the latest changes to issues, reload the page.
Note: An asterisk (*) next to the ID of a box means that the box belongs to more than one group, and/or has more than one eligible box color. Dependency Map chooses the first applicable group/color for the box. Hover with the mouse cursor over the box to see a list of all groups/colors that the box belongs to.
Sorting rows/columns
The Sort dialog allows you to specify how rows and/or columns are ordered in your Map. To open the dialog, click the “Sort” button at the top of the Map view.

First, select the field that you want to configure sorting for.
Dependency Map computes a hierarchical sort, which means that it begins by sorting on the first sort key in the list. Field options that have the same value for the first sort key are ordered according to the second sort key, and so on.
For example, in the image above, sorting is being configured for the Sprint field. With these settings, Sprints would first be sorted according to their status (“closed”, “active”, “future”). Sprints that have the same status would be sorted according to their start date, in ascending order. Sprints with the same start date would be sorted according to their Board ID, and so on.
Click the arrows to move a sort key up or down in the list.
Click on the “Ascending” checkbox to switch between ascending and descending order.
If you want to save your sort settings with your Map, click the “Save” button.
Filtering rows/columns
The Filter dialog allows you to dynamically remove rows and/or columns from your Map. To open the dialog, click the “Filter” button at the top of the Map view.
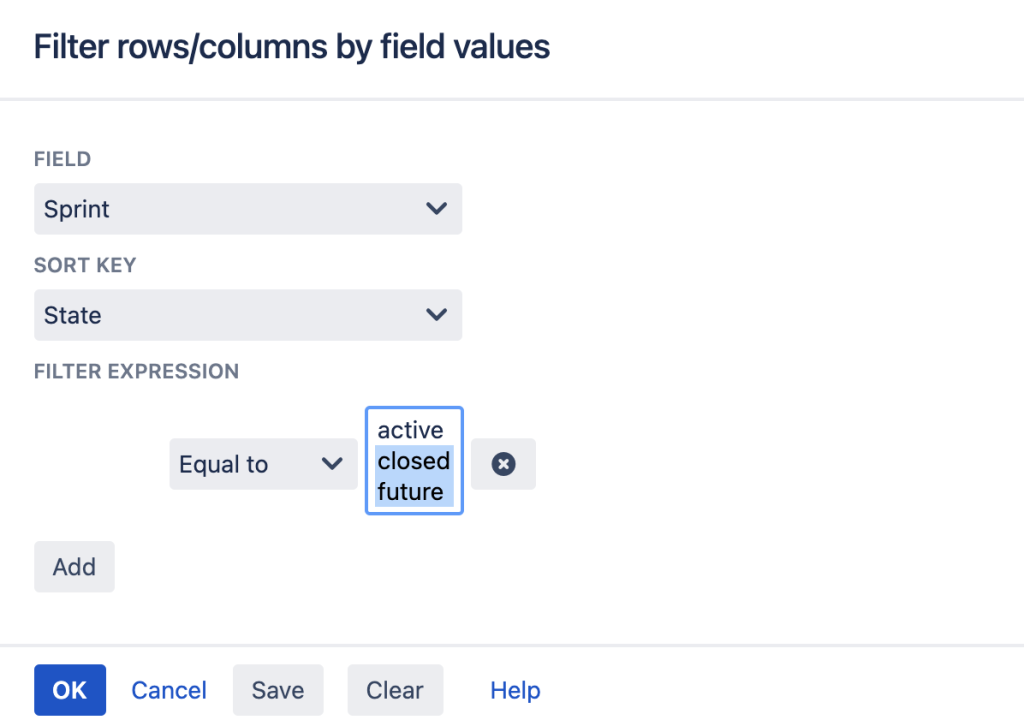
Begin by selecting which field you want to filter.
The filtering engine in Dependency Map evaluates filter expressions. Field options for which the filter expression for all sort keys return true are kept in the Map.
To create a filter expression, begin by selecting a sort key. In the example above, the “State” sort key have been selected.
By default, the filter expression returns true for all field options. Click the “Add” button to add a term to the expression. In the example above, one term has been added. It states that Sprint Statuses that are equal to “active” and “future” should be kept. To remove a term from the expression, click the “X” button next to the term.
The expression terms are different depending on the type of the sort key.
For example, for numbers and IDs you have the option to keep options via larger-than, smaller-than, range, and equal/not-equal comparisons.
For strings (where number comparisons wouldn’t make sense) you instead specify a Regular Expression that the string should match (see Regular Expressions 101 for more information).
Dates are similar to numbers in that you can use larger-than, smaller-than, etc. comparisons, but instead of a number you choose a date using a date selector. All Dependency Map dates are displayed (and selected) in local time.
The “alphabetic” sort key is available for all fields. It corresponds to the name of the field option, as displayed in the Map rows/columns.
To save the filter settings with the map, press the “Save” button.
To clear the filter settings, press the “Clear” button.
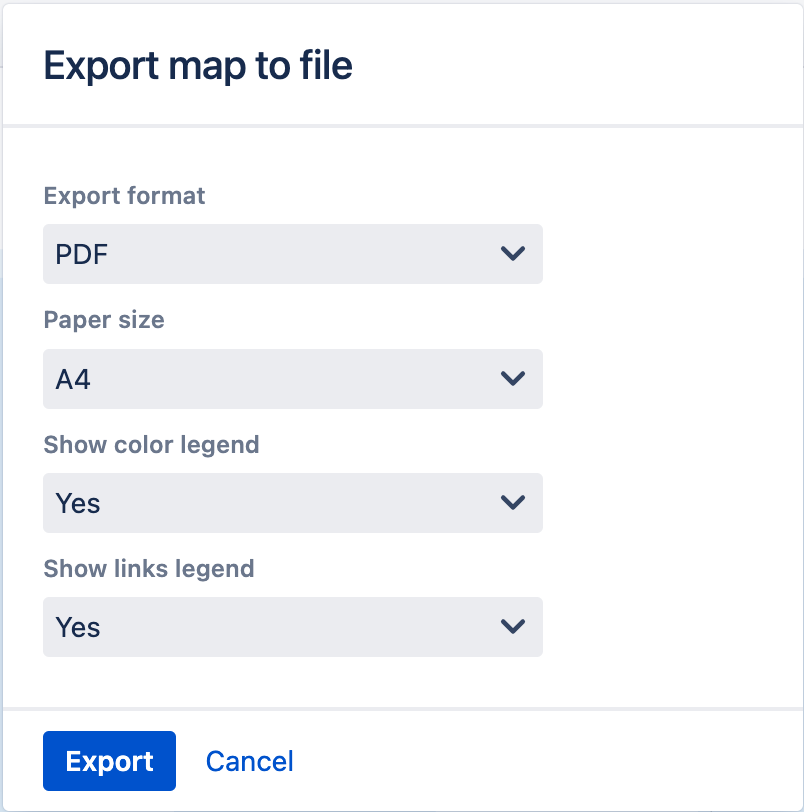
Exporting maps
To export your Map, click the “Export” button at the top of the Map view.
A dialog is opened where you can choose to export as either PDF or SVG.
For PDF, you can choose which paper size to use, e.g. A4, Letter etc.
Exported maps are downloaded by your web browser, and are normally saved to the “Downloads” folder on your computer. The name of the file is set to the title of your Map.
The SVG file format is a vector image format, which means that it is suitable for printing at any scale.
To open an SVG file, simply drag it onto your web browser. (Web browsers are good at displaying SVG files.) From there, you can use the browser’s printing functionality to print the image. Also, many drawing tools, such as Adobe Illustrator, can read and edit SVG files.