Content
Introduction
Dependency Map is a tool for analyzing dependencies and other relationships between issues in your Jira projects. You can highlight different aspects of your project by configuring Dependency Map to use different link types, Jira fields, and diagram layouts.
Since the issues that are shown in your maps are fetched using standard Jira filters, you can choose precisely what to include and what to leave out.
Getting started
After Dependency Map has been installed, a new menu item (“Dependency Map”) will become visible in the Apps menu of Jira and in the Project sidebar.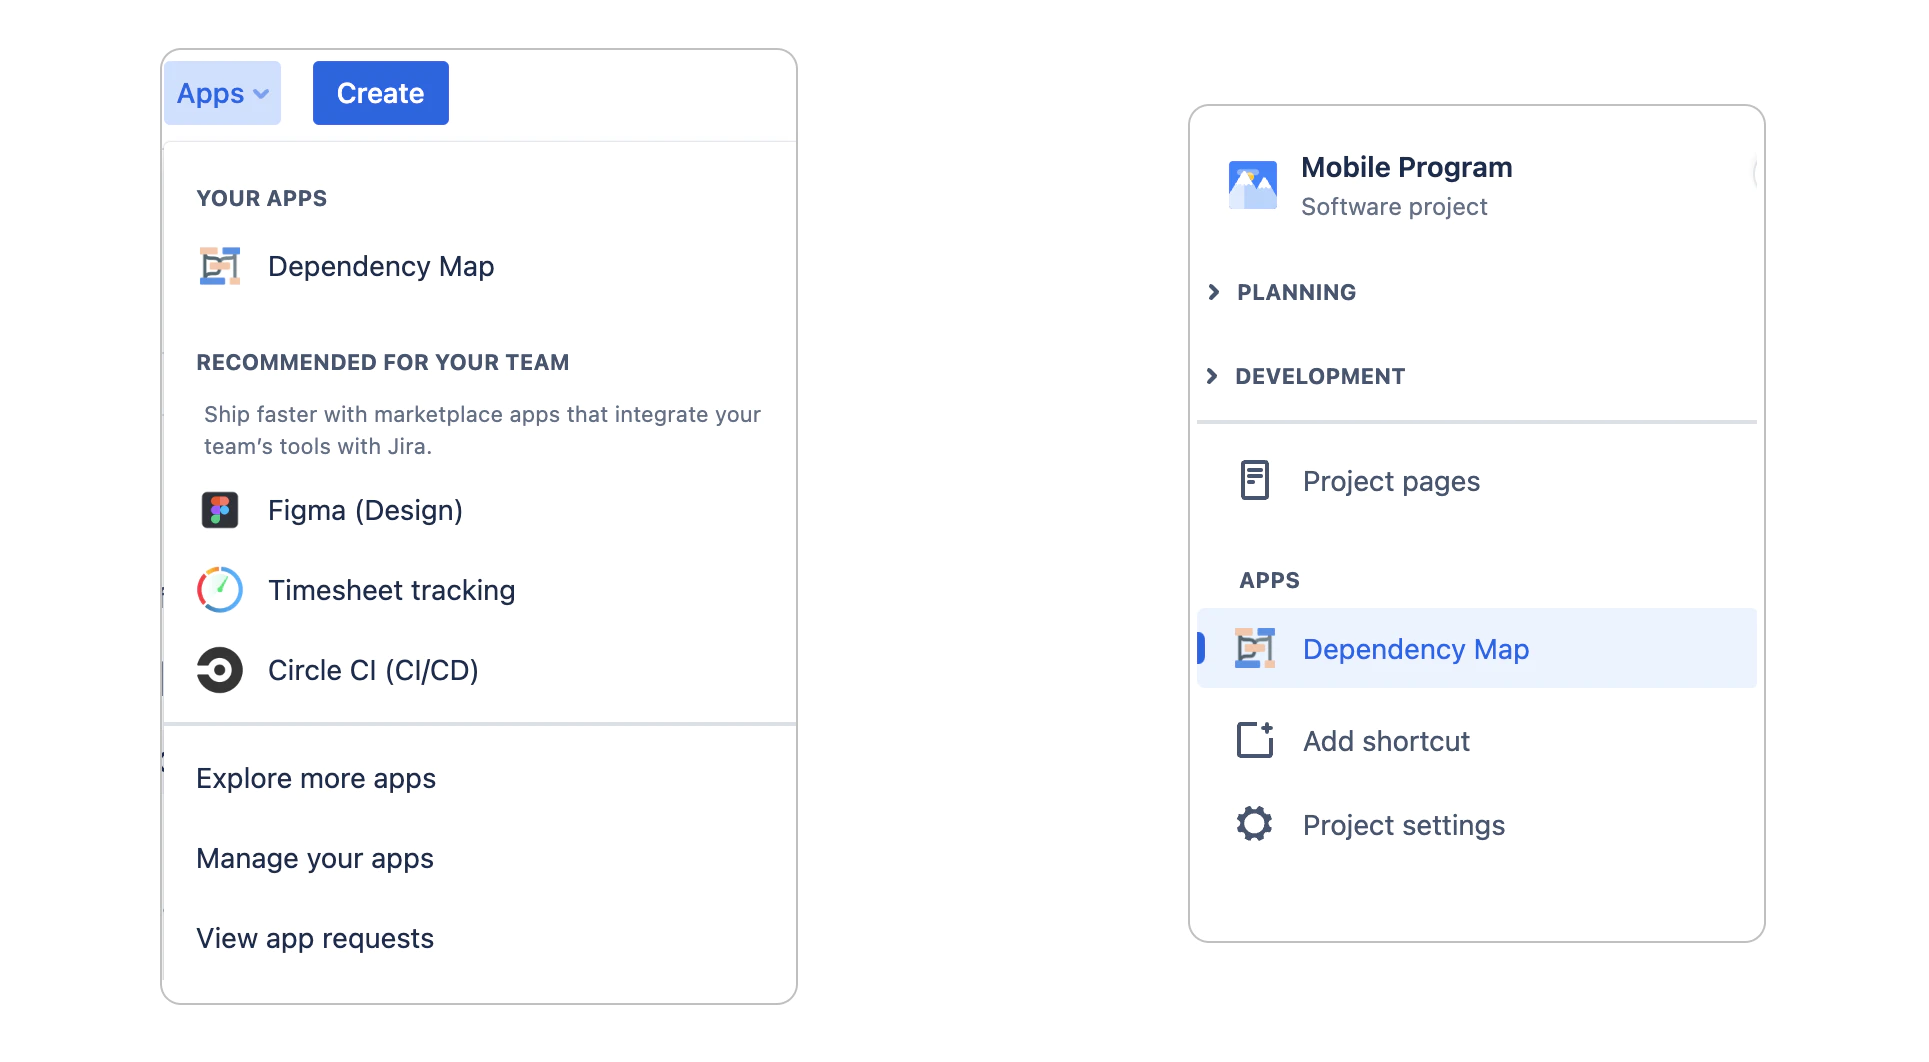
Click “Dependency Map” to open the start page, which lists all available dependency maps.
To open an existing map, click the entry in the list of available maps.
The visibility of a dependency map is the same as the filter it is based on. So if you create a map based on, for example, a public filter then that map will be visible to all users on your Jira server. To limit the availability of a dependency map to a specific set of users or user groups, set the availability of the filter accordingly.
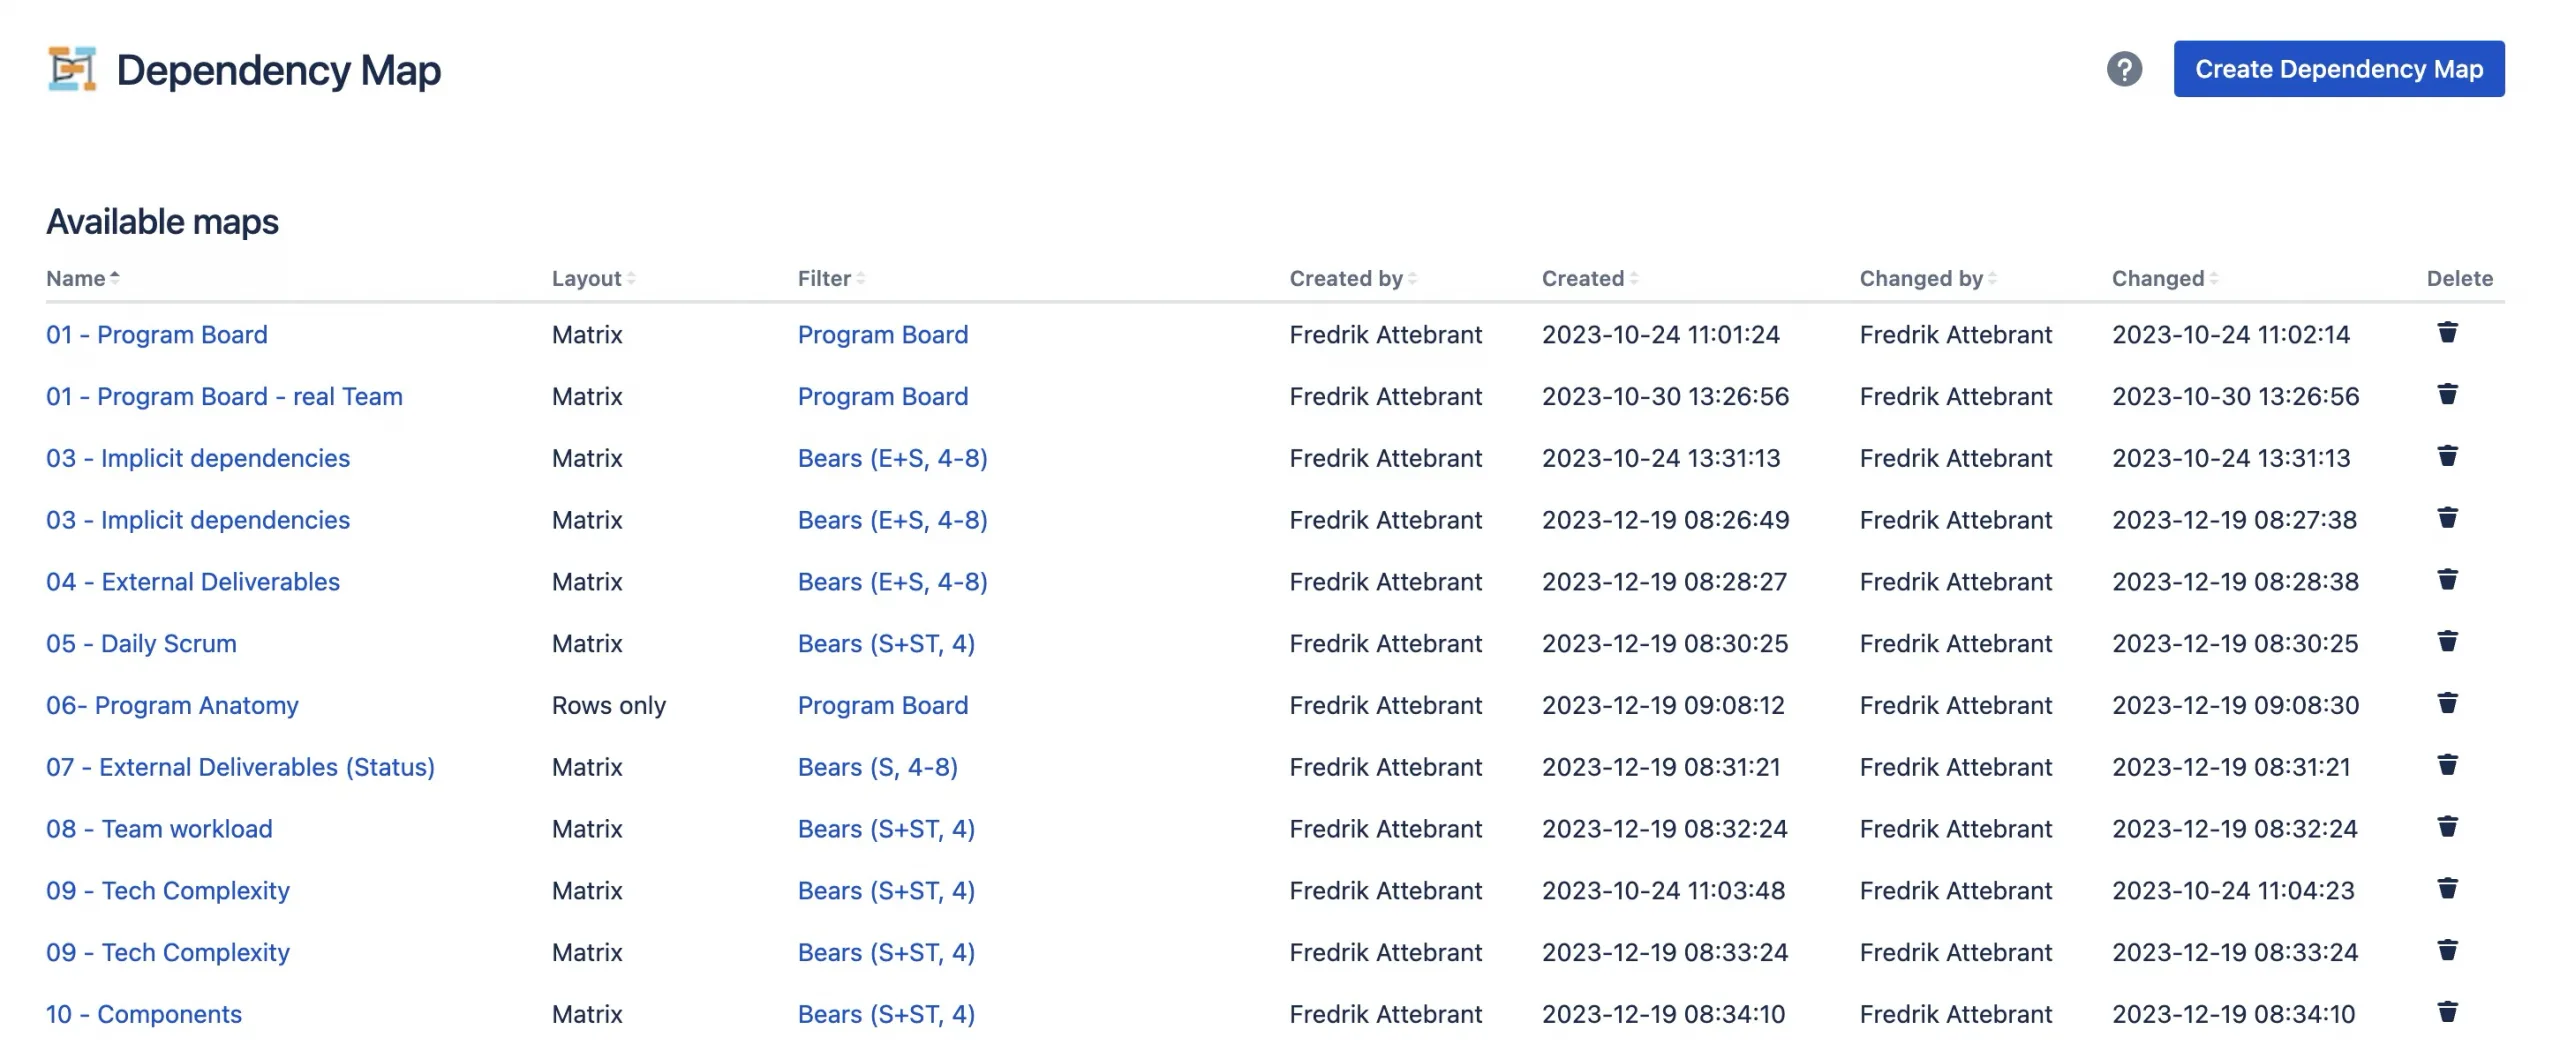
Start page displaying all available maps
Creating a map
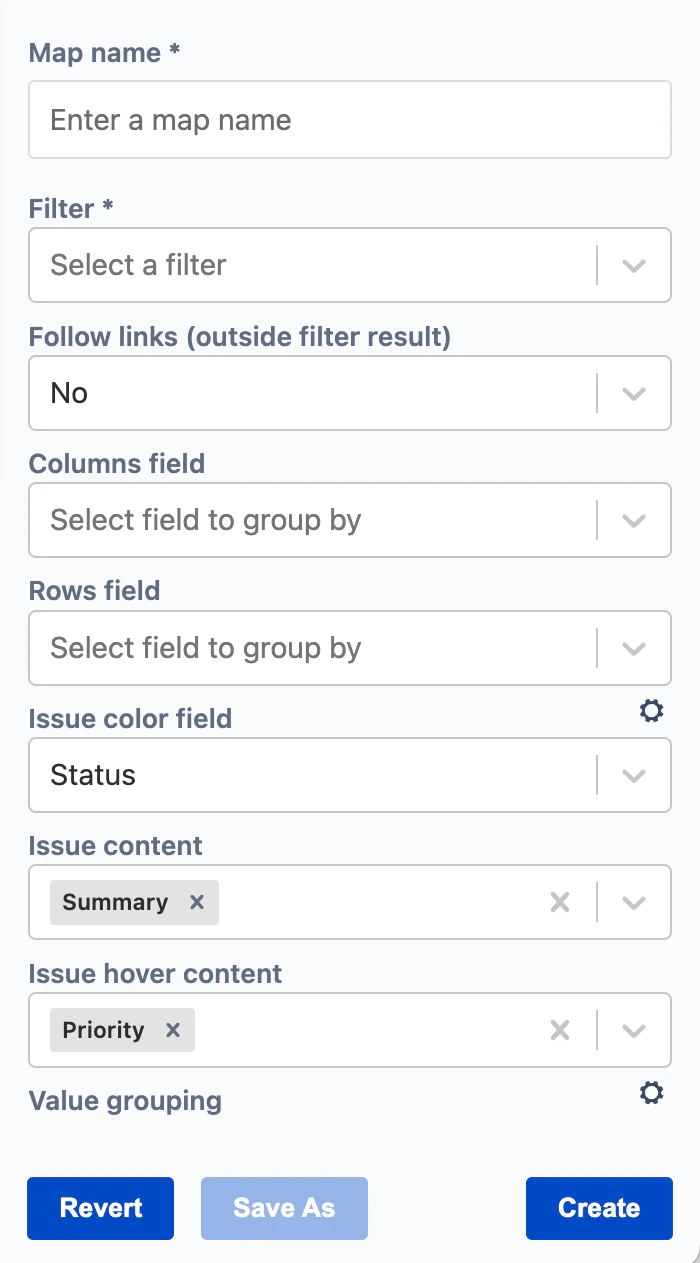
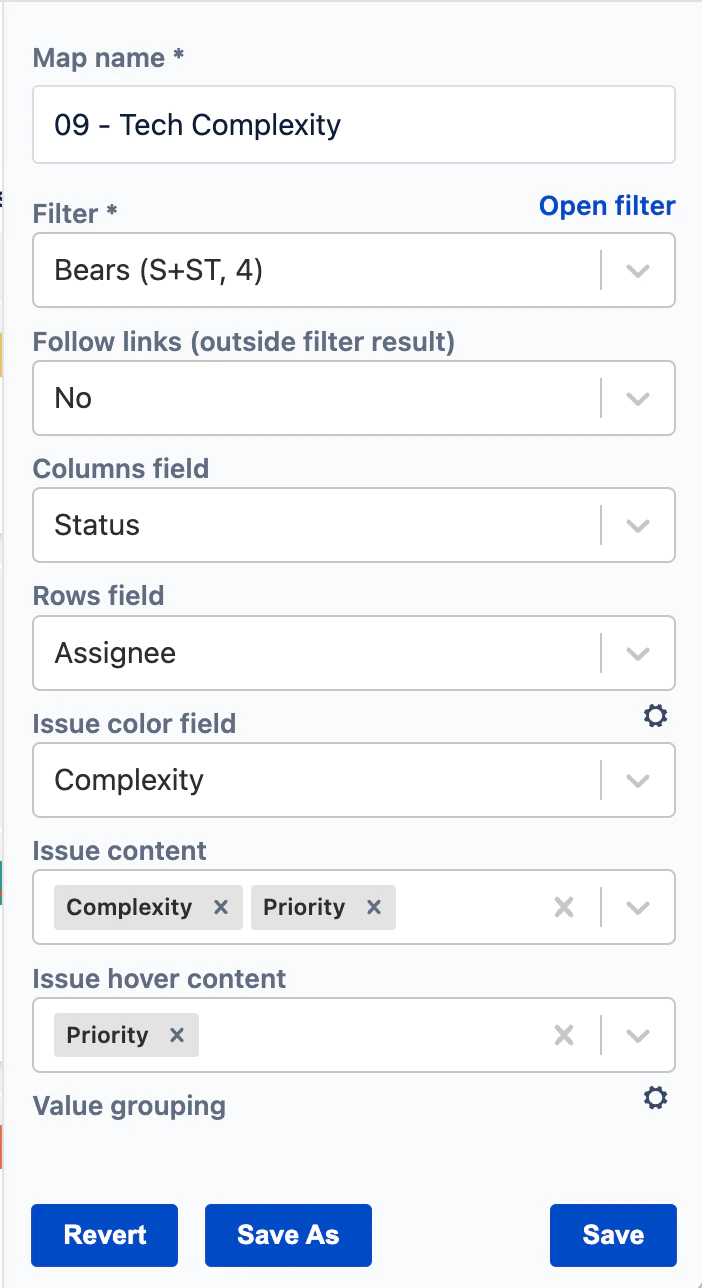
To create a map, click “Create Dependency Map” on the start page. This opens an empty diagram page, with the configuration slide-in visible on the right hand side.
Select a Jira issue filter in the “Filter” dropdown. Type parts of the issue filter name to search for matching issue filters.
As soon as a filter is selected, the diagram will be rendered, displaying the issues.
Enter a name in “Map name” and click “Save” to save the map.
To modify the Jira fields that are used for the rows and columns, select the wanted field in the “Columns field” and “Rows field” dropdowns. You can leave either both or one of the Columns or Rows fields empty to get a map with the issues layed out in an “ungrouped” layout.
To modify the content displayed in the issue boxes, add/remove fields in the “Issue content” entry.
To modify the content displayed when pointing/hovering the mouse over an issue box, add/remove fields in the “Issue hover content” entry.
Use the “Issue color field” to control which Jira field is used for coloring of the issue boxes in the map.
Configuring maps
To modify the configuration of a map, open the configuration pane on the right hand side of the map, either by clicking on the button (<) or just hovering over the slide-in. Clicking the (<) button makes the configuration slide-in stay open, otherwise it will be automatically hidden when moving the pointer away from it. You can also show/hide the configuration by pressing the ] key.
The diagram will be updated automatically when you change the configuration settings. This allows you to directly review your changes. To save the changes, click “Save” or click “Revert” to revert to the saved configuration.
To create a copy of a map, click “Save As”, enter a new name in the dialog and click “Ok”.
Layouts
Maps can have different layouts. The layouts are selected by the fields in the Column and Row fields. If you leave both empty, the map will use an ungrouped layout. If you select a field for either column and/or rows, you will get a matrix layout.
The ungrouped layout attempts to keep all issues at a similar distance from each other and organizes the issues so that link arrows point downwards or sideways, when possible. Issues which have no link to/from other issues are placed at the bottom of the diagram.
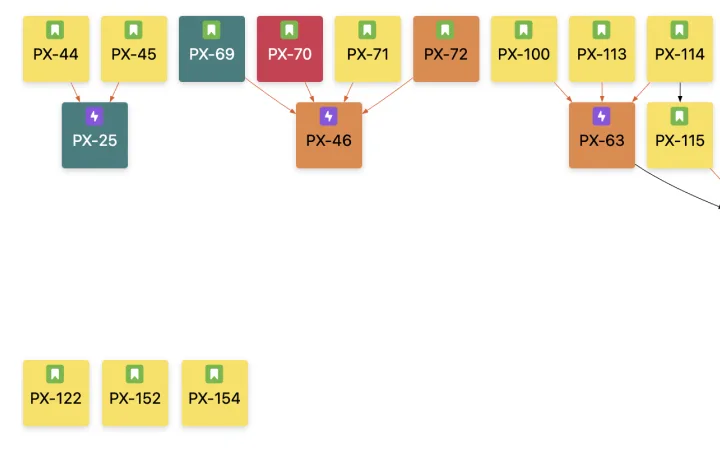
To try out different layouts, simply modify the column/row field selection while viewing the map. Below is an example of an “ungrouped” map, where both the columns and rows fields are left empty:
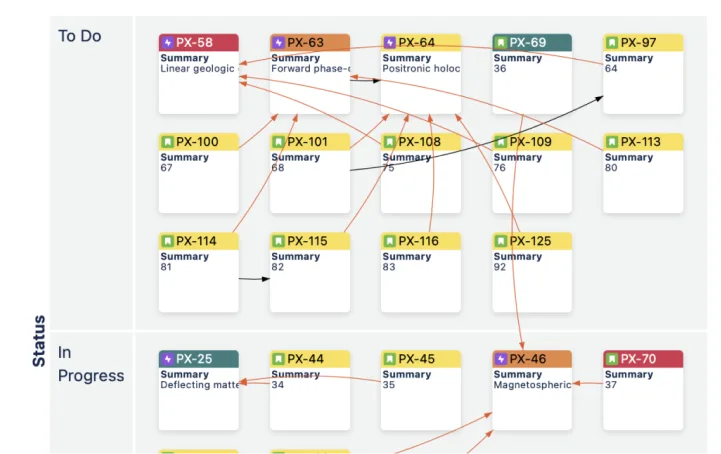
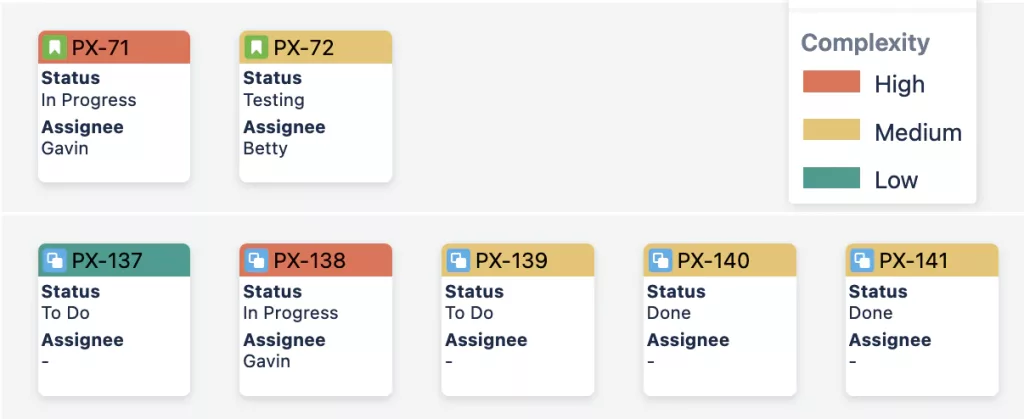
The map below shows an example where Status is selected as the Rows field (the columns field is left empty):
Link following
All Dependency Maps are based on a Jira filter. When a Map is loaded, the filter will return a list of issues to display in the Map.
Sometimes, however, you may want to include issues that are linked to/from those returned by the filter. For example, let’s say that you have a Map based on the Board filter of your Jira Project. This will display all issues in your project, but dependencies to/from other projects will not be included (since those issues are not covered by the filter).
To solve this, you could create a new filter that adds all issues from those projects, but that will result in a Map that displays issues that you aren’t interested in. A better option is to use the Follow links (outside the filter result) option.
The following images illustrates how it works:
Follow links: No
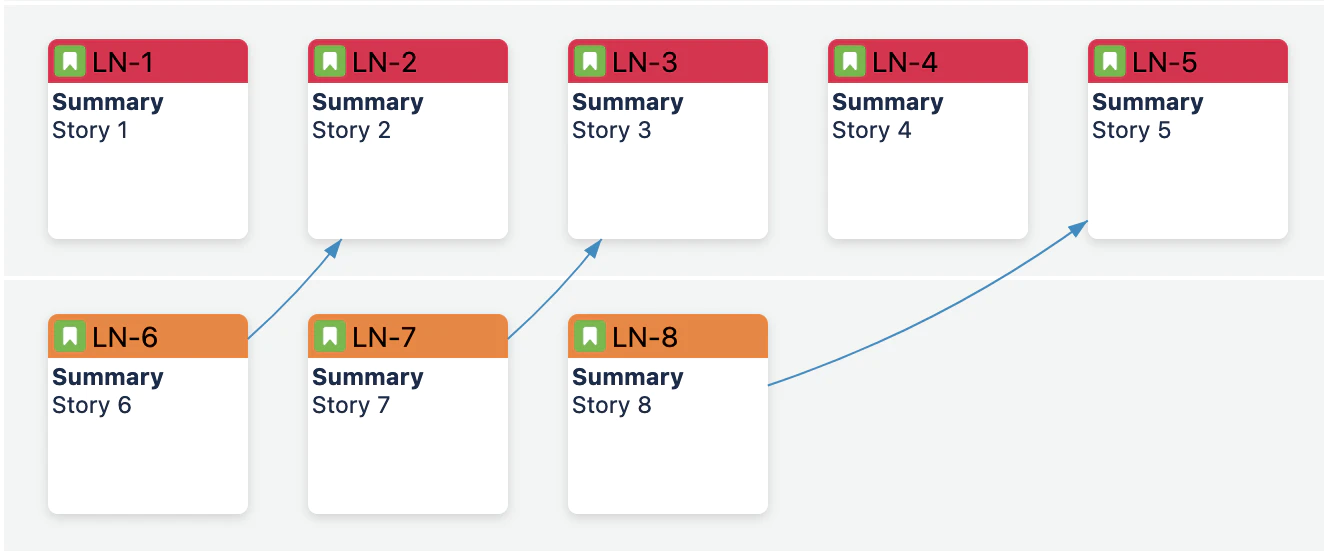
Follow links: 1 step
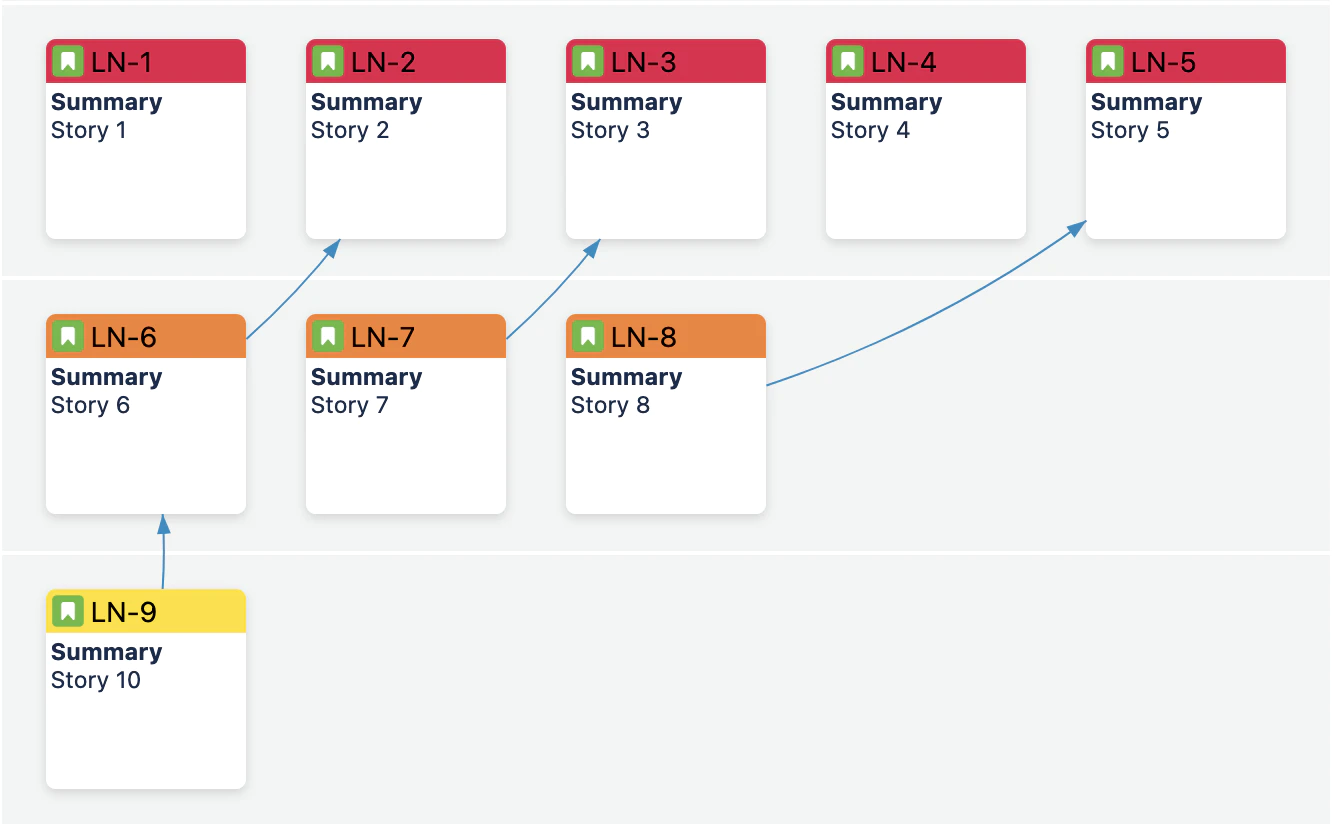
Follow links: 2 steps
Configuring issue colors
When selecting a field for the “Issue color field”, colors are automatically assigned to the available values for the field. If you, for example, select “Priority”, the priority values – Highest, High, Medium, Low, Lowest – will be displayed with a set of default colors. The color mapping is displayed in the “Issue color” legend and can be customized in the map configuration form.
Click the “cog” button ⚙️ above the “Issue color field” to open the customization section:
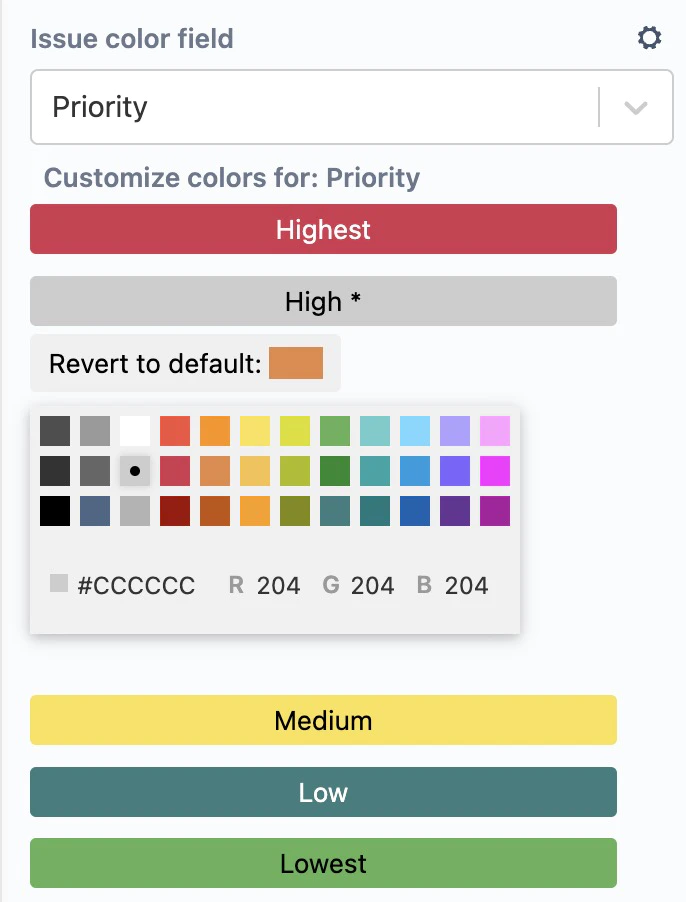
To customize the color for a field value, click the button labeled with the field value and select the desired color in the palette. For a different color than those available in the color palette, you can either enter the hex code or the RGB value for the color.
Tip: use e.g. https://www.color-hex.com/ to find more colors.
When a color is customized, the color button is marked with a (*).
To revert to the default color for a customized value, click the “Revert to default” button (which also displays the default color).
How to work with a dependency map
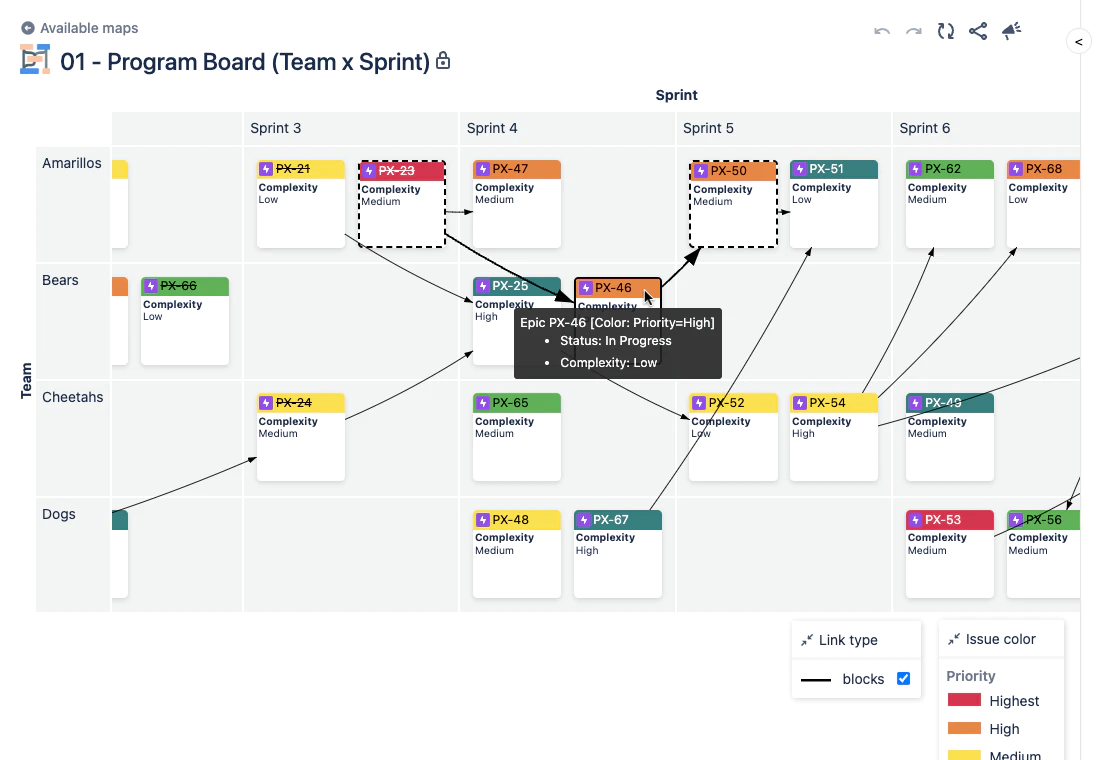
Once the map is shown, you can navigate it using your mouse and/or trackpad.
To pan, click the left mouse button and drag (or use the pan gesture on your trackpad).
To zoom, use the scroll wheel (or pinch gesture on your trackpad). If you zoom in far enough you will see the Summary of the issue, instead of just the issue key.
To select an issue, click on the issue. To select additional issues, hold control or command and click on the issues. In addition to highlighting the selected issues, Dependency Map will also highlight their links, and any linked issues:
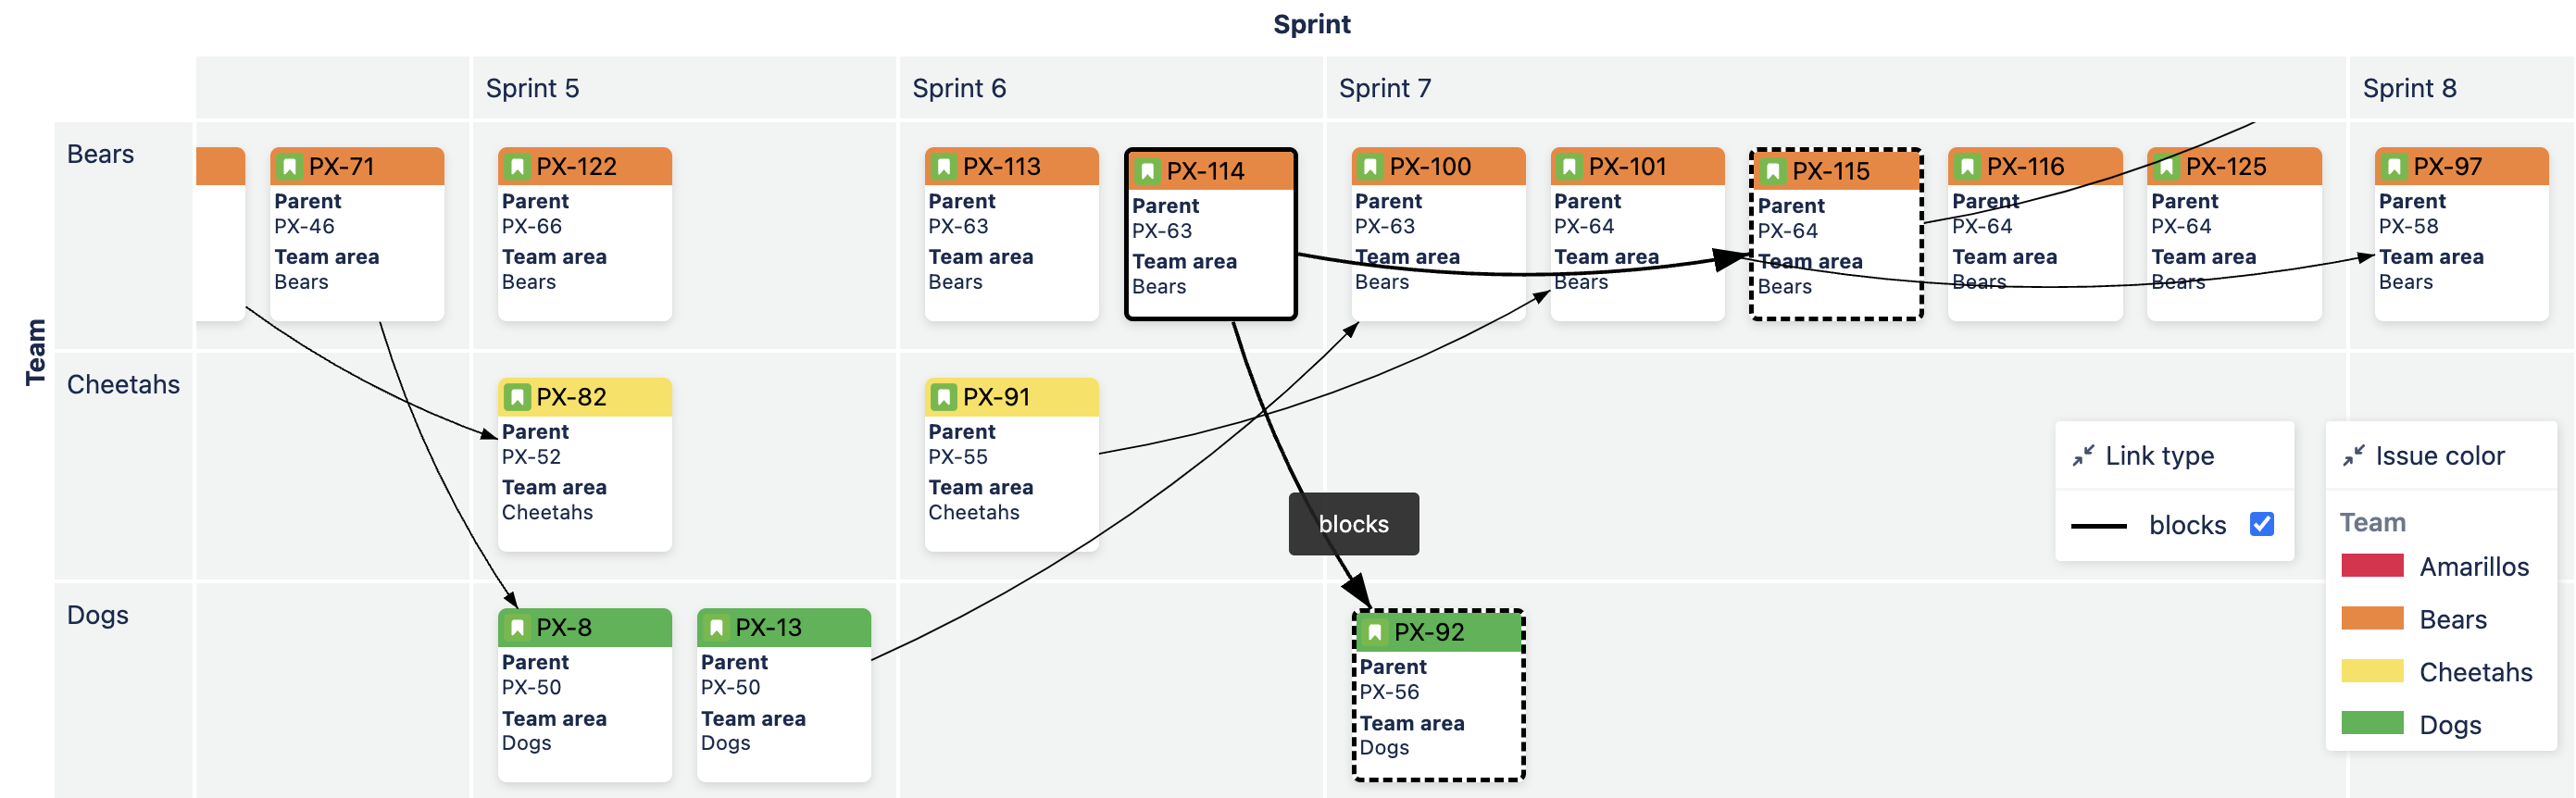
The “Link type” legend shows what links are displayed in the map:
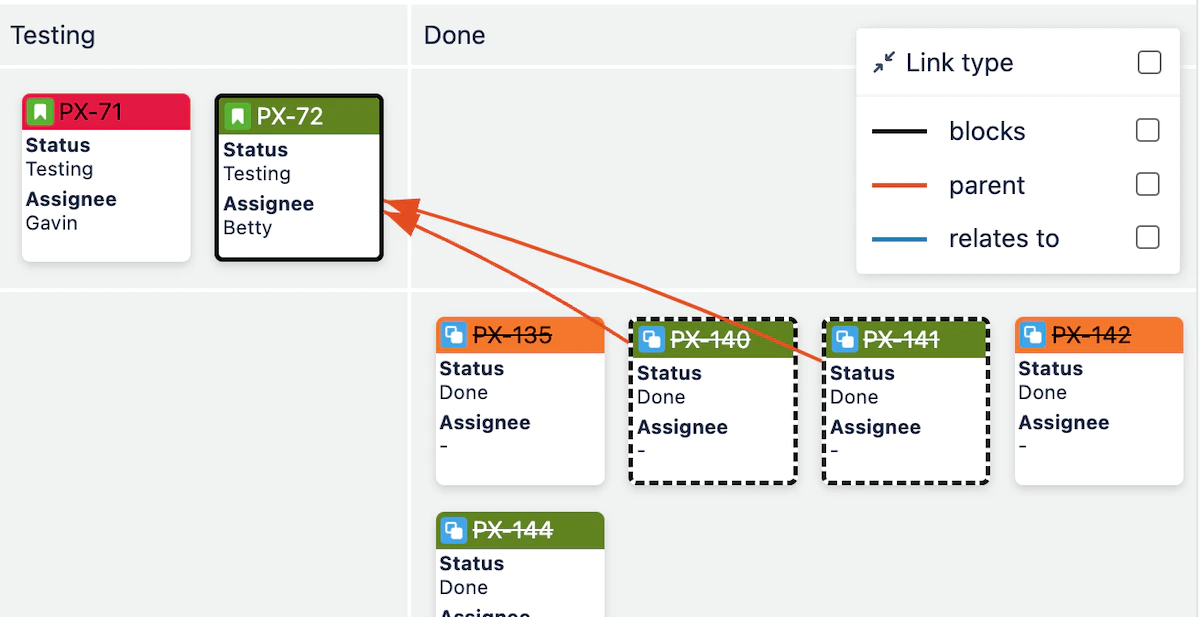
To show or hide links, click the checkbox next to the link type in the Links box. Note that selecting issues will still highlight the links to/from those issues.
The Issue color and Link type legends can be moved by simply dragging them.
To edit an issue in Jira’s standard issue screen, click the issue key at the top of the issue box (e.g. PX-72 in the example above).
The Issue Color legend shows how the colors of the issue boxes are mapped to values.
Toolbar
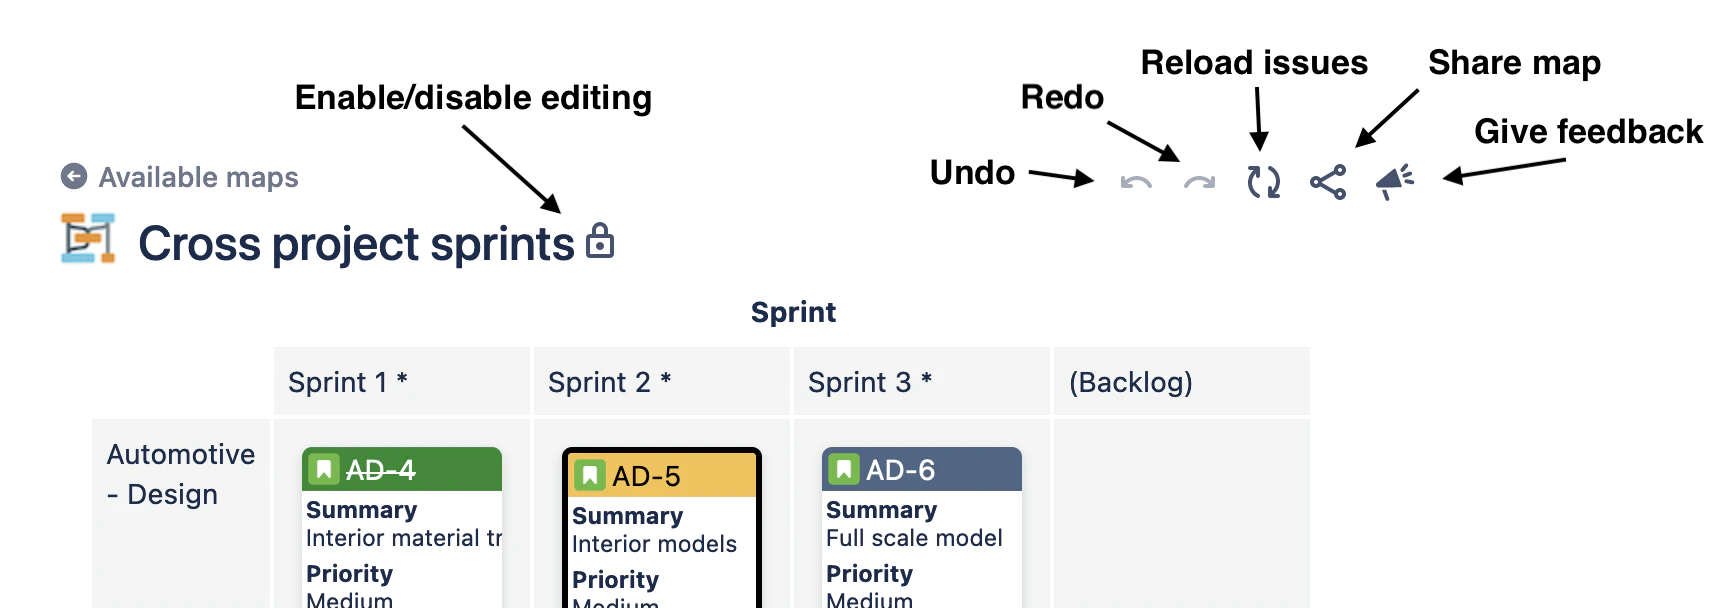
Dependency Map has a toolbar at the top of the page with the following buttons:
 Enable/disable editing – click the lock button to enable editing.
 Undo – click to revert changes. The tooltip displays details about what will be undone.
 Redo – click to reapply previously undone changes. The tooltip displays details about what will be undone.
- Reload issues – reloads the latest changes to issues and updates the map. The Undo/Redo stacks are cleared.
- Share map – click to share the map. Copies a direct link to the map to your clipboard.
- Give feedback – let us know what you think and propose new features.
Dragging and dropping issues
Dependency Map supports changing issue fields by dragging and dropping issues in the diagram. This is available when the issues are organized in rows and/or columns.
A change is done by dragging an issue from one cell to another. This allows the user to change either one or two fields.
A change can be reverted by clicking “Undo” (as long as the reverse change is permitted – see Limitations).
An “undone” change can be “redone” by clicking “Redo”.
A typical workflow can be as follows:
- Open a map.
- The map opens in read-only mode, this to prevent unintended changes when viewing the map.
- To start updating issues, click the “lock”button next to the map title.
- To change an issue, select it and then drag and drop it on the desired cell. The background of the cells are then colored as follows:
- Blue – indicating that the issue can be dropped here
- Grey – indicating that the issue cannot be dropped here
- Green – indicating that the issue is over a cell where it can be dropped
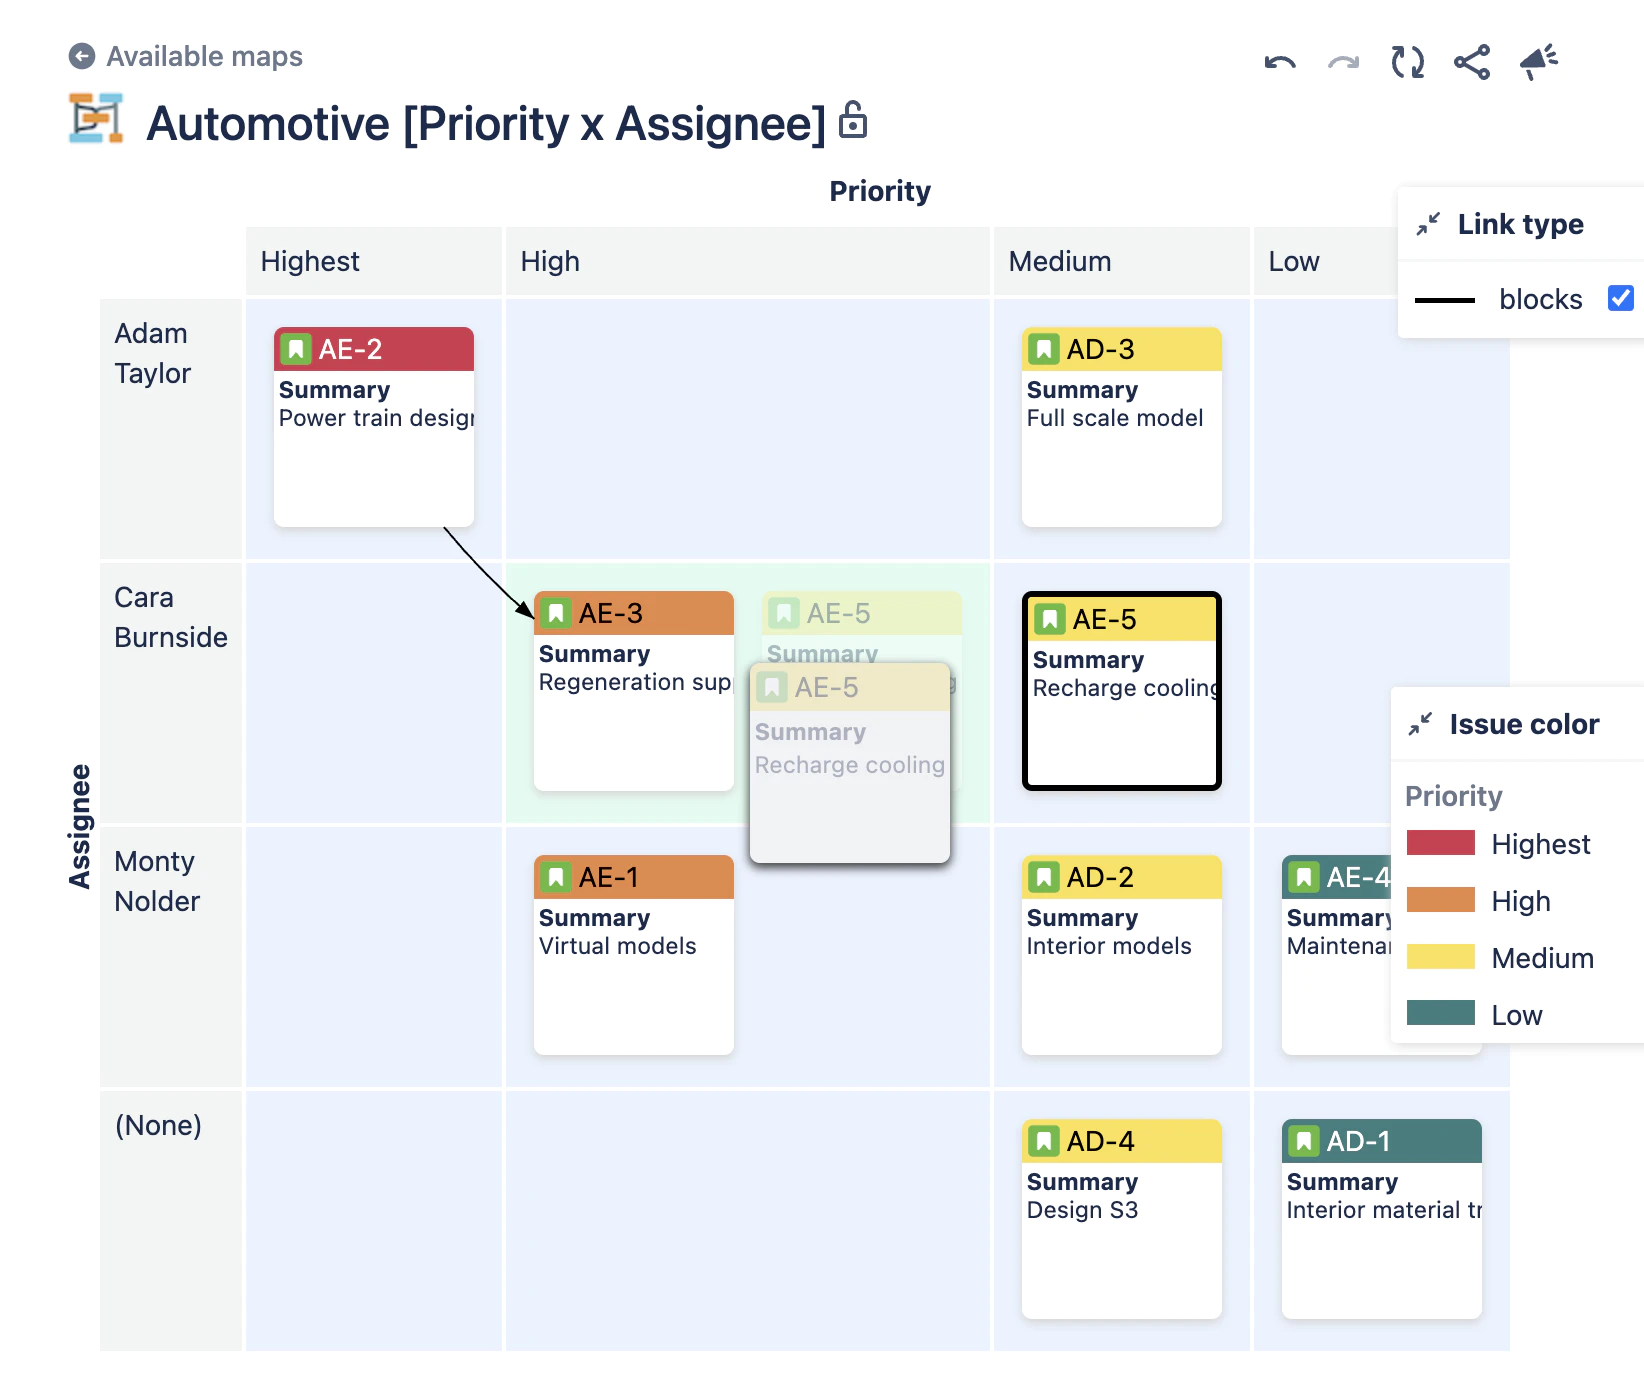
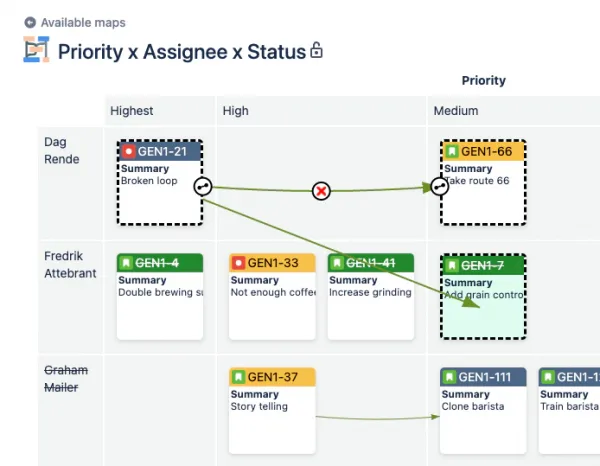
- Example map showing Priority by Assignee. Shows how the issue AE-5 is dragged from the Medium priority column and can be dropped on the High priority column, as indicated by the green cell background
- When the issue is dropped, the change is committed and a status message appears in the lower left corner summarizing the committed changes:
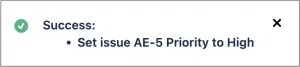
Changes to issue AE-5 successfully applied.
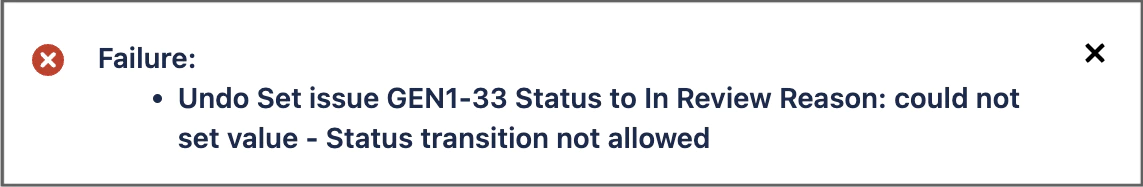
Change of Status not permitted due to the workflow.
- To undo a change, click the “Undo” button in the top right toolbar
- Tip: The tooltip displays what will be undone.
- To redo a change, click the “Redo” button in the top right toolbar
- Tip: The tooltip displays what will be redone.
Creating, modifying and deleting links
Dependency Map supports adding, modifying and deleting links in the diagram. This is available in all layouts (column, row, matrix and “ungrouped”). See below for how to work with links. Each operation can be reverted and redone by clicking the “Undo” ![]() and “Redo”
and “Redo” ![]() buttons in the toolbar.
buttons in the toolbar.
Creating a link
Links are added by clicking an issue and dragging a link to its destination issue.
- Open a map.
- The map opens in read-only mode, this to prevent unintended changes when viewing the map.
- To start updating links, click the “lock”button next to the map title.
- To add a link between to issues:
- Click the issue where the link shall start and a “link handle” is displayed:

- Drag from the handle to the issue to link to.
- While dragging, a black arrow visualizes the link to create and issues under the mouse change to green to indicate valid link destinations.
- Release to add a link.
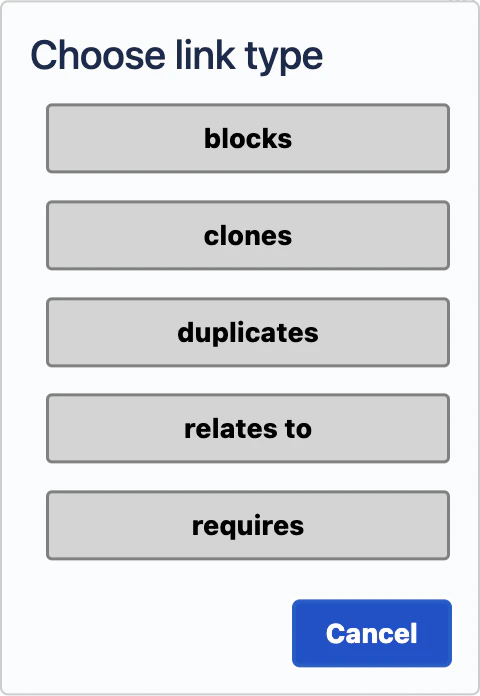
- A dialog is displayed where you select which type of link to create:
- Click the issue where the link shall start and a “link handle” is displayed:
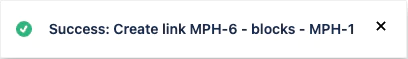
- The change is committed to Jira and a status message appears in the lower left corner summarizing the committed changes:
Modifying a link
Links can be modified by clicking the link and dragging the link handle ![]() on either end to the wanted issue.
on either end to the wanted issue.
- Open a map.
- The map opens in read-only mode, this to prevent unintended changes when viewing the map.
- To start updating links, click the “lock”button next to the map title.
- To move a link, click the link.
- The link is marked with 2 move handles and one delete button
 .
.
- The link is marked with 2 move handles
- Drag either end of the link to the desired issue.
- Drop it when the destination issue is highlighted with green.
- Click the image below to see the animation of

- The destination issue is marked with green if the move is allowed.
Deleting a link
- Open a map.
- The map opens in a read-only mode, this to prevent unintended changes when viewing the map.
- To start updating links, click the “lock”button next to the map title.
- To delete a link, click the link.
- The link is marked with 2 move handles and one delete button.
- Click the delete button (or press Delete on the keyboard).
- Confirm or cancel the delete operation in the dialog.
- To restore the link, click the “Undo”
 button in the top right toolbar.
- Tip: The tooltip displays what will be undone.
- Revert the undone change by clicking the “Redo” button in the top right toolbar.
Grouping of issues
Dependency Map can group issues for row, column and color. Do this by selecting a field for the columns, rows and/or issue color.
When selecting a field, the issues are grouped based on the field values each issue has.
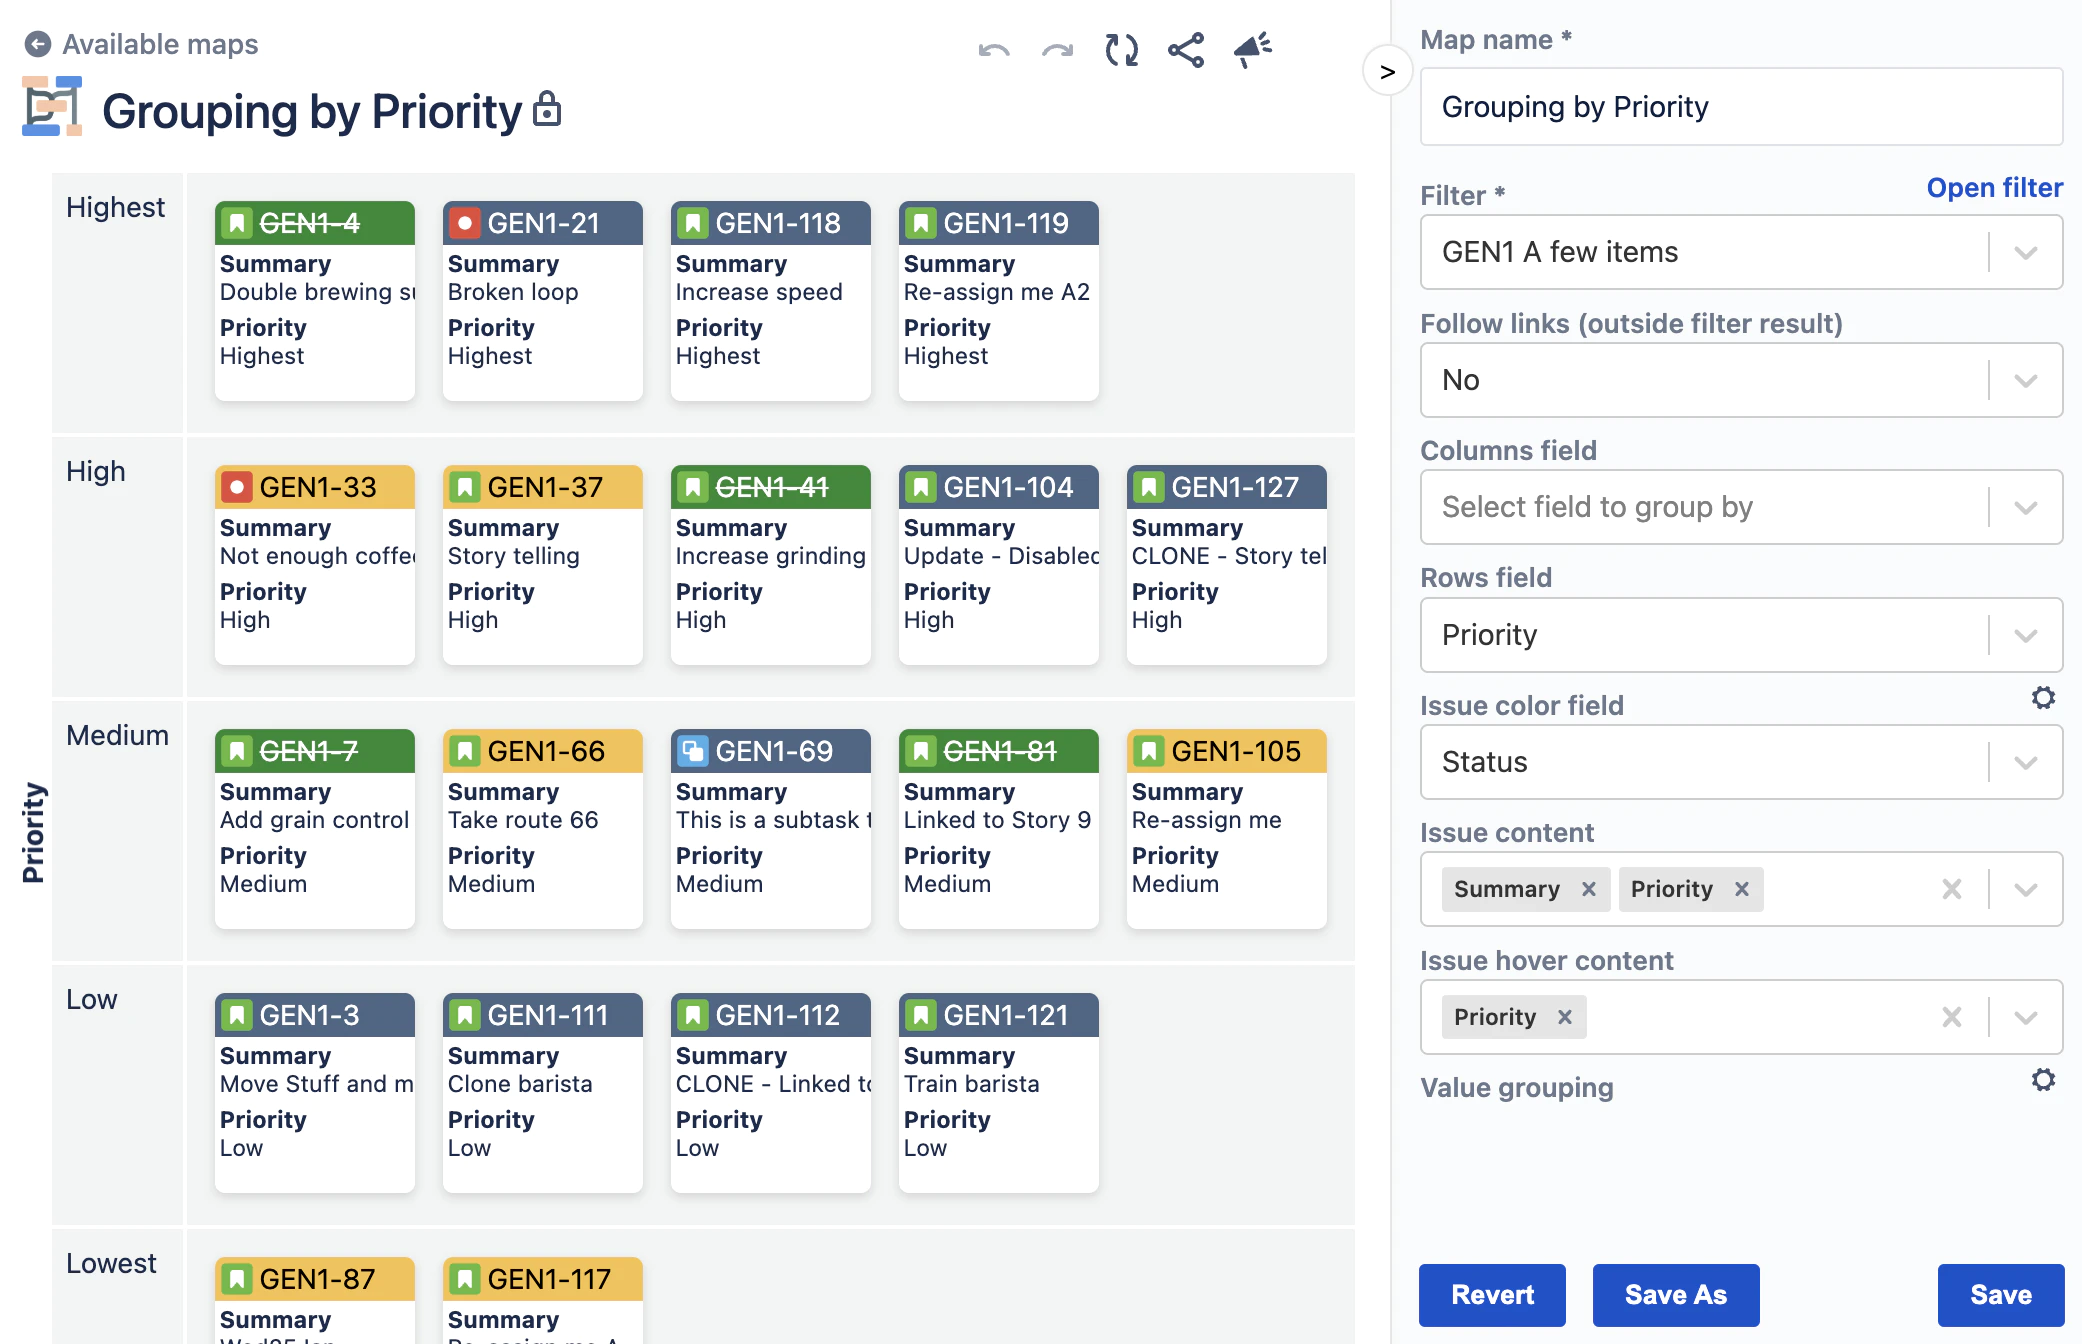
If you select e.g. Priority for Rows field, the issues in the diagram are grouped in rows where all issues in a row have the same Priority:
Modifying how issues are grouped
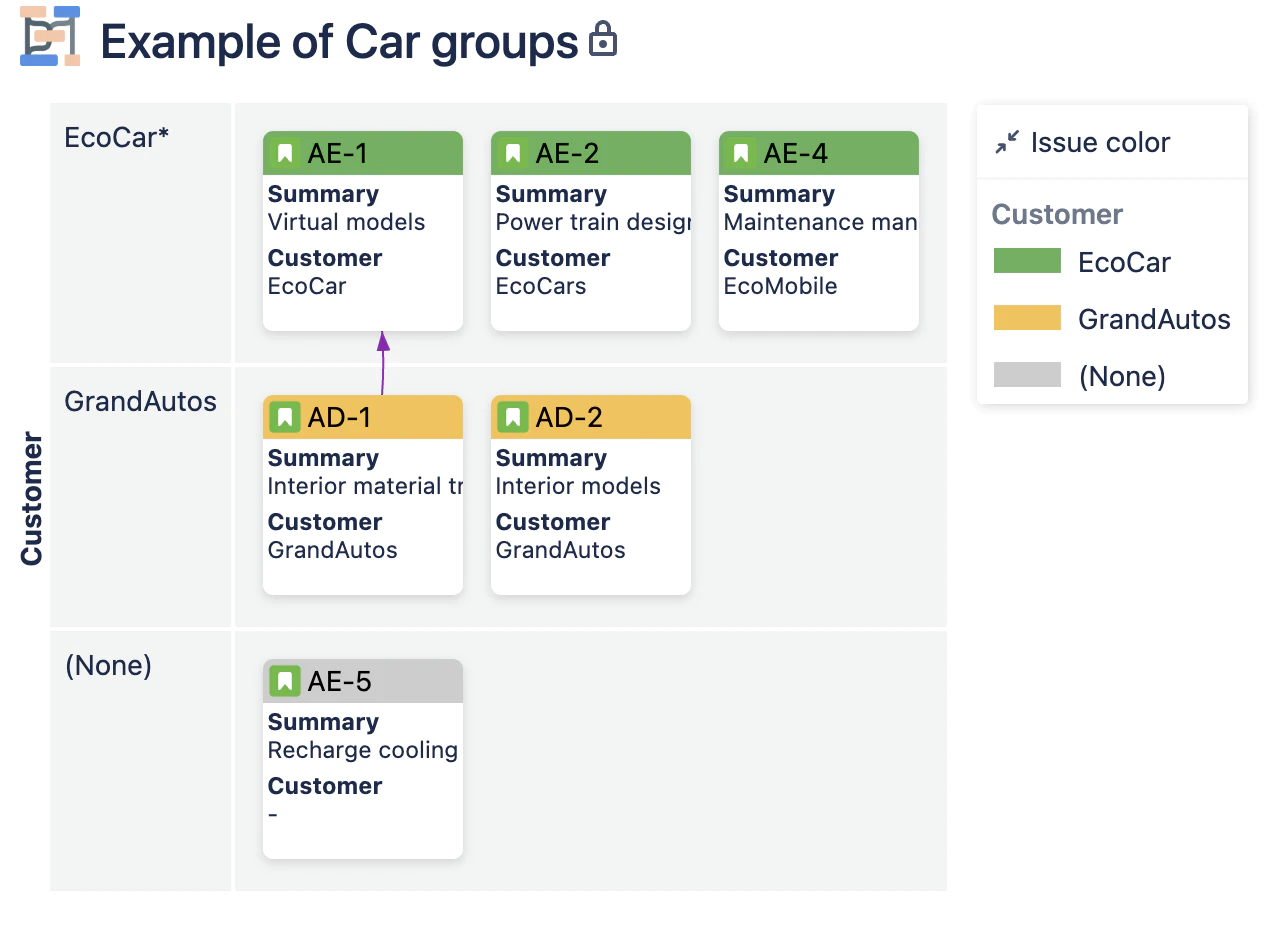
In some cases, the values need to be modified to get a better grouping of issues in the diagram. Consider displaying a field for Customer as the row grouping. Issues for the same customer are grouped together in the same row:
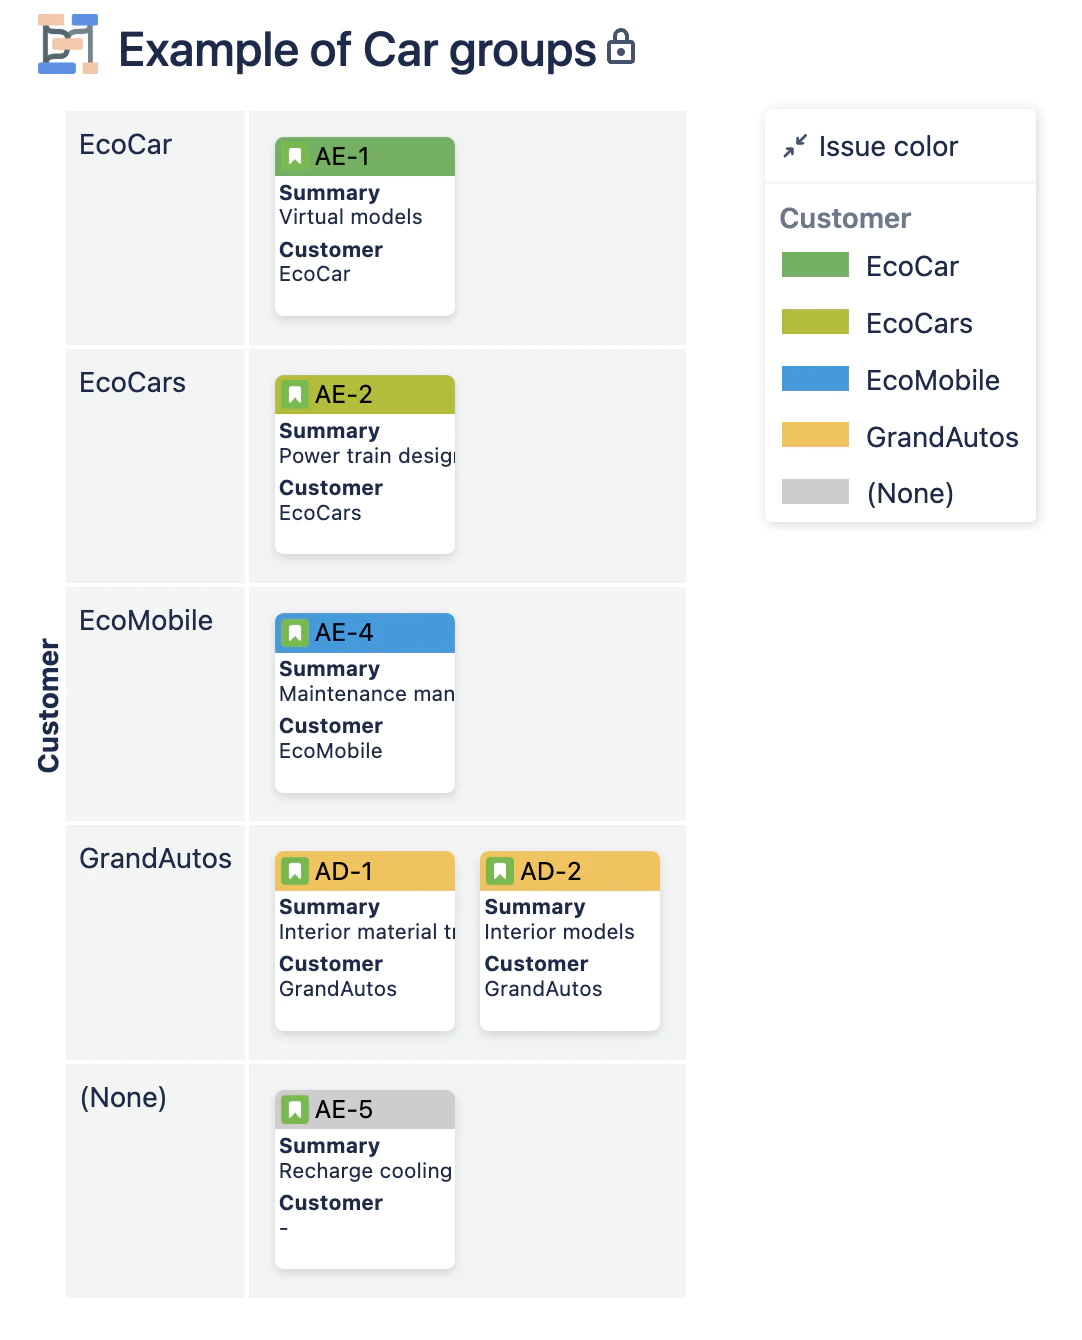
There might be different values representing the same customer, which we want to get into the same row. In this example, we want to group the issues for EcoCar, EcoMobile and EcoCars together under the name EcoCar.
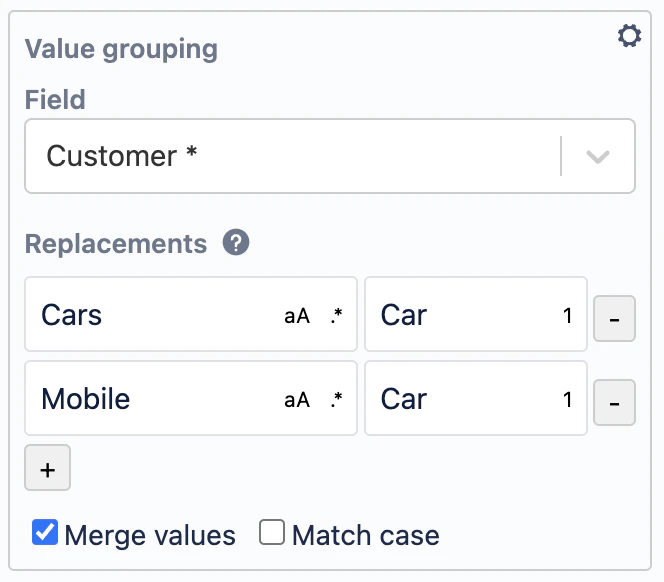
Do this by opening the configuration form.
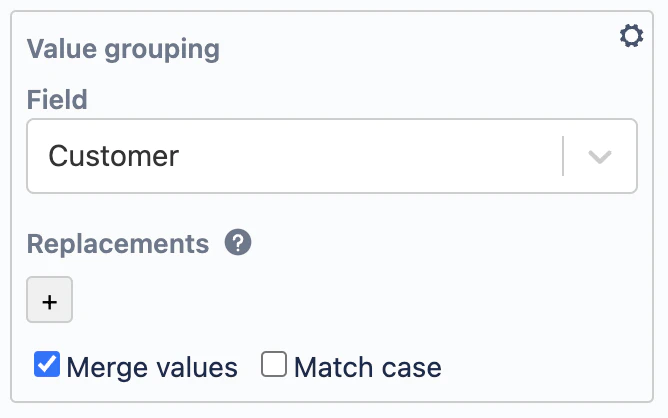
Expand “Value grouping” by clicking the ⚙️:
- In the Field dropdown, select the field: Customer
- Click the ‘+’ to add a ‘Replacement’:
- Add “Cars” -> “Car”
- Again, click ‘+’ and add “Mobile” -> “Car”
Note how the 3 values for Customer – EcoCar, EcoCars and EcoMobile are now grouped as Ecocar*:
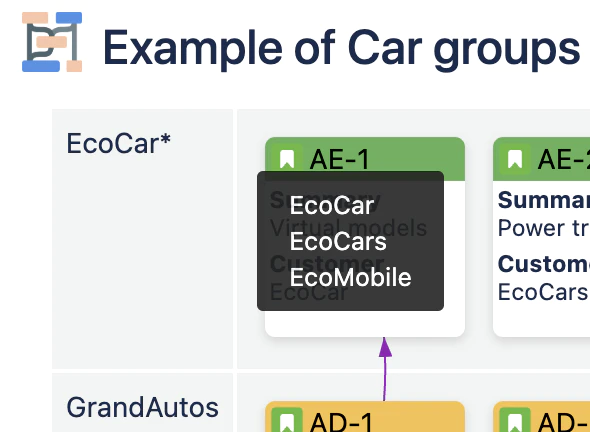
The ‘*‘ in the row title, indicates that the row is displaying merged values. By hovering the mouse pointer over the title cell, a tooltip appears displaying the merged original values (EcoCar, EcoCars, EcoMobile):
Controlling merging of groups and matching by case
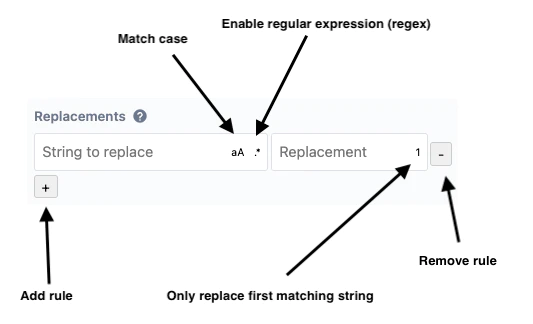
There are two checkboxes at the bottom of the “Value grouping” settings:
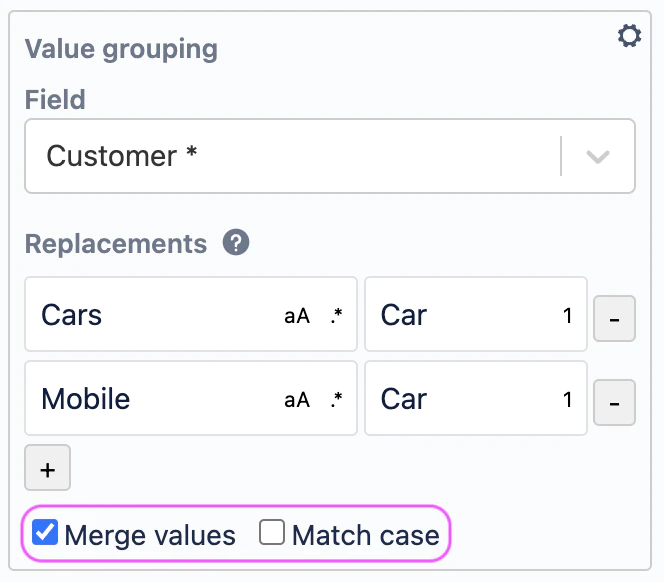
- With “Merge values”, you toggle the grouping of values on/off.
- With “Match case”, you control whether the case is considered or not when grouping values.
Basic string replacements
The replacements fields have support for either basic string replacement – as in the example above – or regular expressions (regex). With basic string replacement, the string you enter into the field on the left side is replaced with what you enter on the right side, e.g. “Mobile” is replaced by “Car”. By default, the matching is done without considering the case. Click the aA button to match the case.
Replacing “C” with “X”, “EcoCar” would become “EXoXar”.
With matching case, the result would be “EcoXar”.
In the replacement field on the right side, you can click the 1 button to ensure that only the first match will be replaced.
With “first only” enabled, the result would be “EXoCar”.
Advanced replacements with regular expressions (regex)
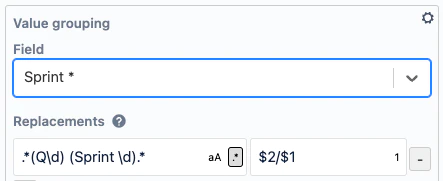
While basic string replacement can cover many cases, a more advanced replacement configuration is sometimes needed. Displaying Sprints from multiple projects is an example of this. By default, Dependency Map uses a regular expression rule for sprints – see more about this in the “Sprints” section.
To enable regular expressions in the ‘String to replace‘ field, click the .* button.
The example of grouping customers can be done using regular expressions as follows:
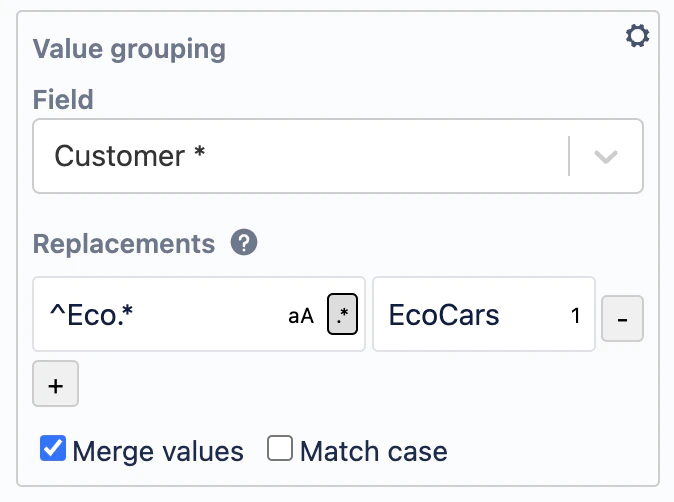
- Enable regular expression by clicking the .* toggle
- Enter the replacement expression – what to match:
- ^ – match from the beginning
- Eco – match the string ‘Eco’
- . – matches any character
- * – matches the previous expression as many times as possible
- What the replace with:
- EcoCars – Insert the plain text: EcoCars
Learn more about regular expressions
Learn about regular expressions here:
- Basic: https://medium.com/geekculture/regular-expressions-for-non-programmers-ed2047d2181f
- More detailed: https://www.sitepoint.com/learn-regex/
- You can also try out your regular expressions at: Regular Expressions 101
Please note that Dependency Map uses the “ECMAscript / Javascript” flavor of regular expressions.
Sprints
By default, Dependency Map applies a replacement and merges sprint names. Sprints containing “Sprint N” anywhere in the name will be changed to just “Sprint N”. So “ABC sprint 1”, “ABC sprint 2”, “Sprint 1 xyz” will become “Sprint 1 *” and “Sprint 2”. Hovering over “Sprint 1 *” will list the original names “ABC sprint 1”, “Sprint 1 xyz” together with state (future, active or closed), start and end date for each sprint.
This consists of two parts:
- Replace the sprint name with the part that matches “Sprint N” where N is a number. This means that a sprint named “ABC Sprint 1” and “Sprint 1 xyz” will become “Sprint 1*”, while “ABC Sprint 2” will become “Sprint 2”.
- Merge all “renamed” sprints. This means that if we have multiple sprints that result in the same “renamed name”, they will be joined and displayed in one group.
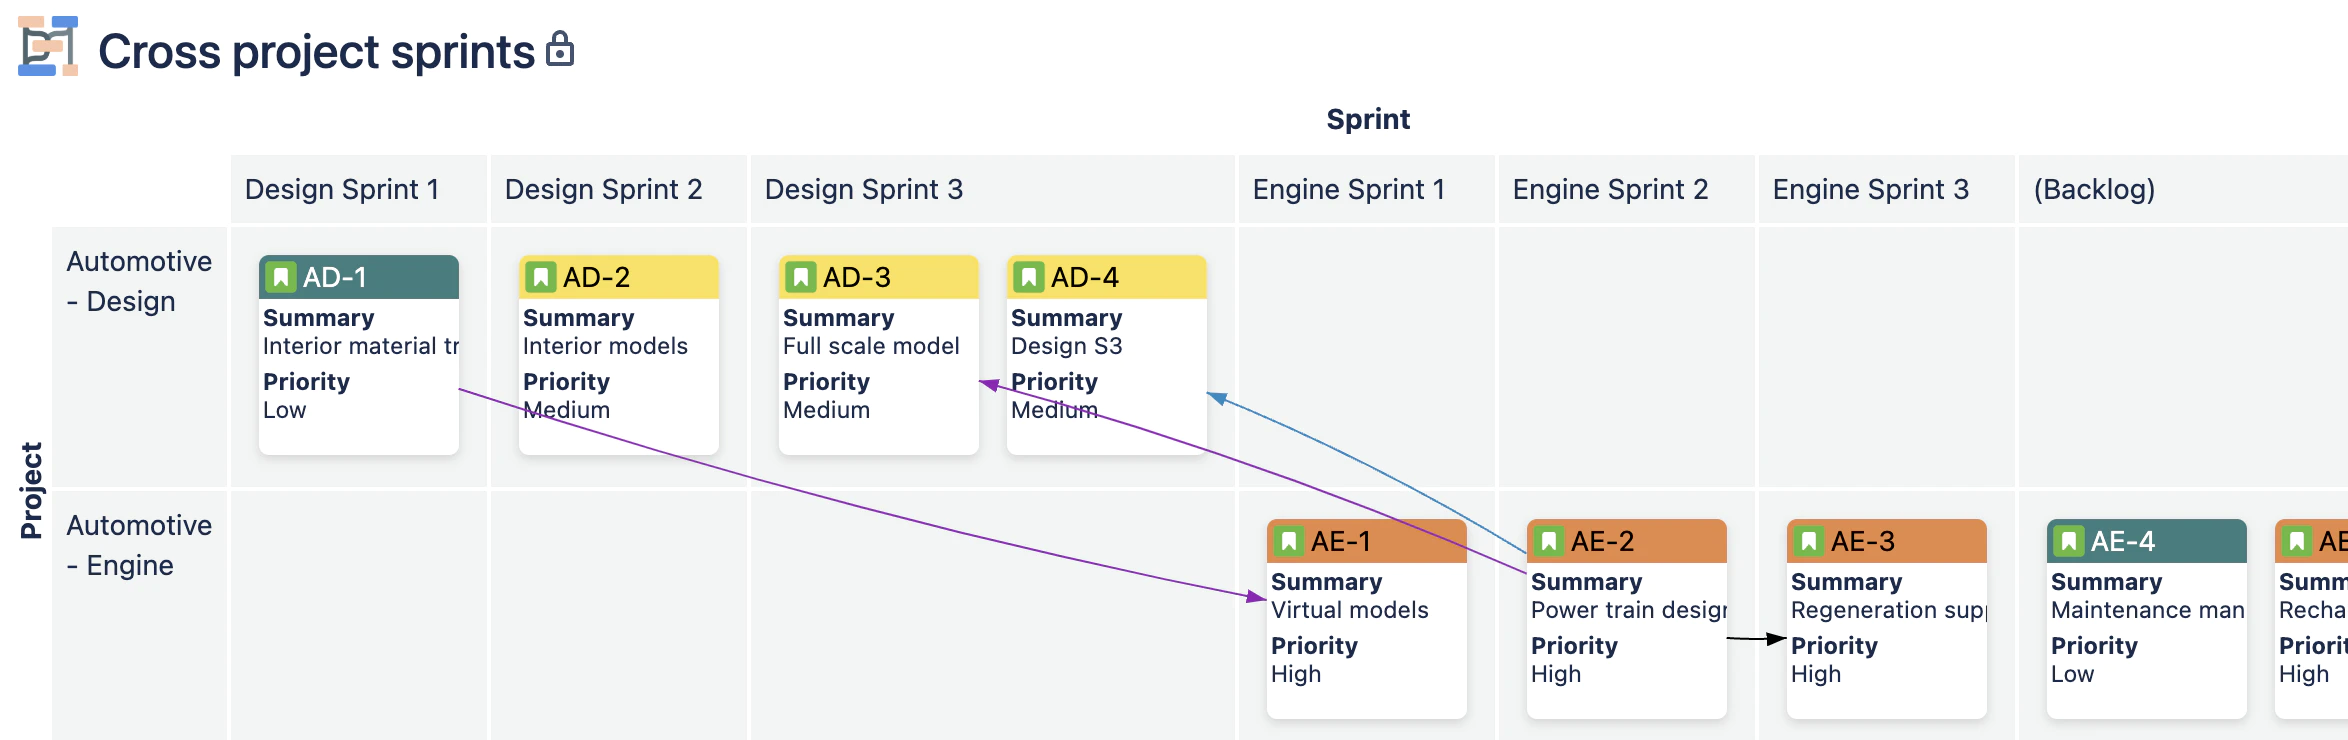
This is particularly helpful when displaying issues from multiple projects in one diagram. Below is an example of this where issues from two projects are displayed:
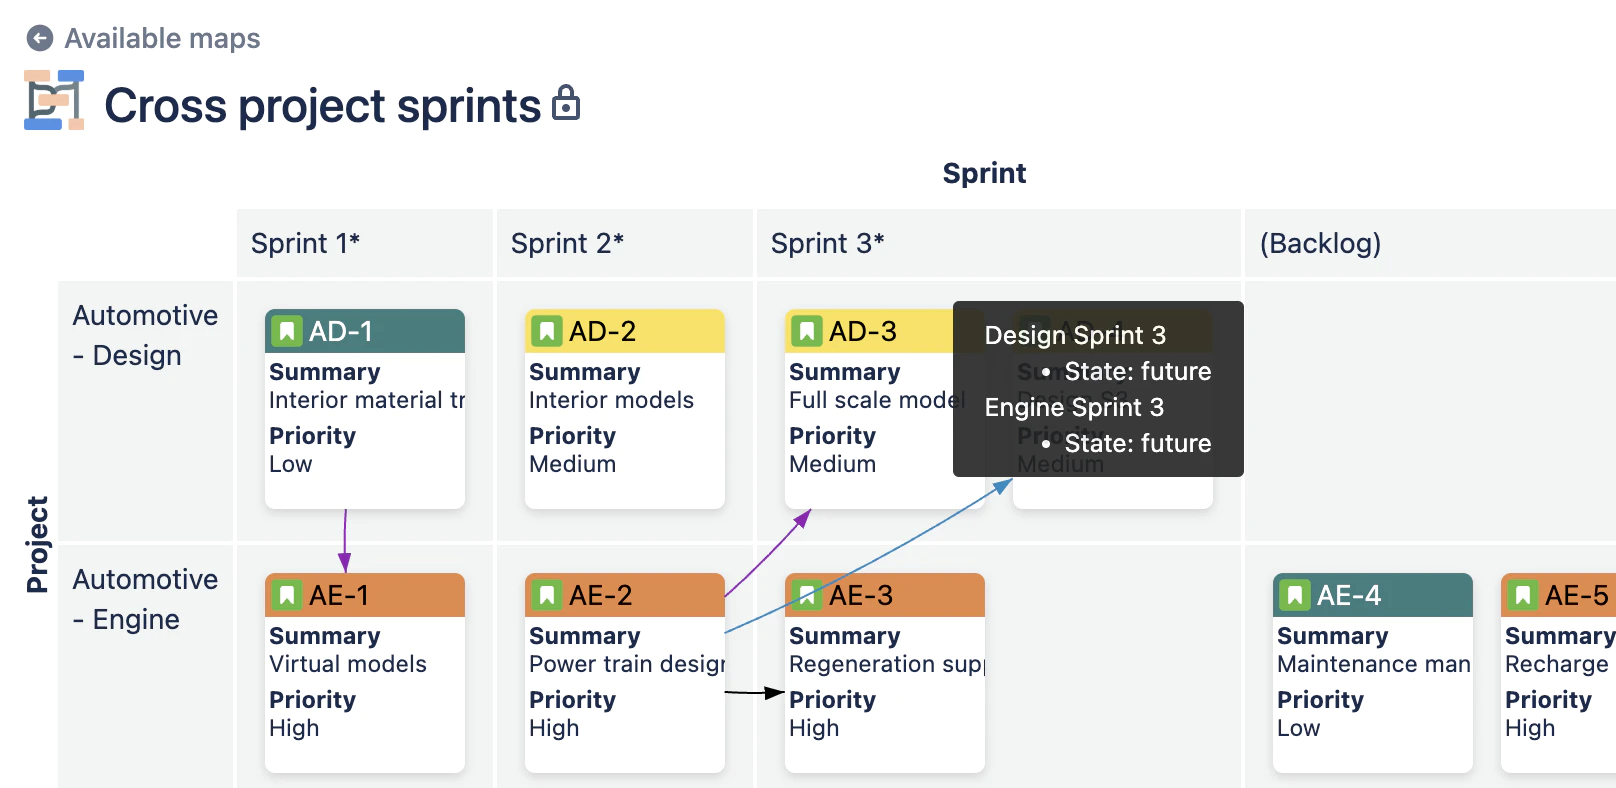
Without the merging and renaming, this would look like this:
The default rule for grouping and merging sprints is as follows:
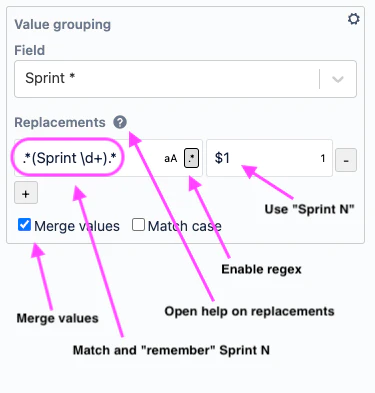
The left part is read as: match any characters followed by “Sprint ” (note the space), followed by one or more decimal digits followed by any text. The parenthesis captures the text inside. The $1 in the right part inserts the captured text there ($1 is what starts with the first left parenthesis).
As you may guess, some characters have a special meaning in a regex. So if you want to match a plain left parenthesis you have to use \(. The same for the characters “.+*[{” and some more. For some characters the backslash gives them a special meaning – \d matches any decimal digit, and \s any space character (blank, tab, end-of-line).
Reordering parts of a name
Sometimes it can be necessary to reorder parts of a name to get the desired presentation.
Consider a sprint naming like:
- BOM Q2 Sprint 3 – where we have a prefix (BOM), a quarter+number (Q2) and the sprint (Sprint 3).
We can then use the regular expression to reorder the quarter and sprint parts.
To display the sprints as: Sprint 3/Q2 and so on, we can use the following rule:
Replacement controls
Statuses
Dependency Map automatically groups status with the same name. This helps when the issues in a map belong to projects with different workflows, but with the same name.
An example is a map where the status of the issues all have the same name, e.g. “To Do”, but the status is defined for different (Team managed) projects (the issues belong to different projects), then the issues will be grouped together as status = “To Do”.
Note: Merge values are always enabled for Status in the “Value grouping” settings.
Tips and tricks
Before an issue can be changed, Dependency Map needs to get the current issue data from Jira. As this takes little while, the color indications in the map do not appear directly. If you first click on an issue before dragging it, Dependency Map fetches the issue data and gives you quicker feedback on where the issue can be moved.
What’s next
In coming releases we will add support for additional customizations of how the issues are visualized in a map. See the roadmap for updated plans.
Limitations
- Undo is only possible if the reverse change is permitted. Exceptions to this include (but not limited to):
- Workflow not permitting a status transition
- Assignee cannot be set to an inactive user
- Issue cannot be moved to closed sprint
- The history of changes are cleared when reloading the page.
- With this release, fields which can have multiple values (e.g. Labels) can not be changed with drag-drop.
Known issues
- Links may render strange in ungrouped layout. Work around: Click the Reload Jira issues button or the reload the browser page.